Welcome to PVOL
PVOL stands for Planetary Virtual Observatory and Laboratory and is a searchable database of ground-based observations of solar system planets.
The images are made available by amateur astronomers and are used for research purposes by several professional and amateur teams and for
astronomy popularization. The images are an important resource for astronomical research and have been used in a large number of scientific publications (a partial list
is available in the Publications from PVOL data tab above.
Important note: The use of Artificial Inteligence (AI) tools in noise reduction and image processing in astronomical images and in planetary images
in particular is strongly discouraged. AI tools avaialable for this purpose are not mature enough for this field, and produce
artificially looking images where true features are removed and unreal features are added to the images.
Planetary images processed with AI tools and resulting in an evident distortion of real features in the image
will be removed from the PVOL database.
Here is a longer and more detailed statement.
How to navigate through the website
The top menu will guide you to different sections of the website. Try the tab Search data to find data. Submit your images by e-mail to: pvol@ehu.eus.
 Acknowledgement: We sincerely acknowledge the generosity of the large community of amateur astronomers in making
their observations of solar system planets available to the scientific community and the general public. This project
is part of VESPA (Virtual European Solar and Planetary Access),
which is part of Europlanet 2020 RI and
Europlanet 2024 RI.
Europlanet 2020 RI has received funding from the European Union's Horizon 2020 research and innovation programme under grant agreement No 654208.
Europlanet 2024 RI has received funding from the European Union's Horizon 2020 research and innovation programme under grant agreement No 871149.
Acknowledgement: We sincerely acknowledge the generosity of the large community of amateur astronomers in making
their observations of solar system planets available to the scientific community and the general public. This project
is part of VESPA (Virtual European Solar and Planetary Access),
which is part of Europlanet 2020 RI and
Europlanet 2024 RI.
Europlanet 2020 RI has received funding from the European Union's Horizon 2020 research and innovation programme under grant agreement No 654208.
Europlanet 2024 RI has received funding from the European Union's Horizon 2020 research and innovation programme under grant agreement No 871149.
Full information about VESPA can be found at http://www.europlanet-vespa.eu/.
News and Observational Alerts
2023-12-29
 There are two reports of two impacts in Jupiter separated by 24 hr on 28-29 December 2023.
 If confirmed this could be a series of impacts from a fragmented body colliding with Jupiter over a longer time.
Observers interested to follow-up this event should check ALL THEIR VIDEO observations from the last few days and in the next few days to look for potentially new impacts to the two reported below.
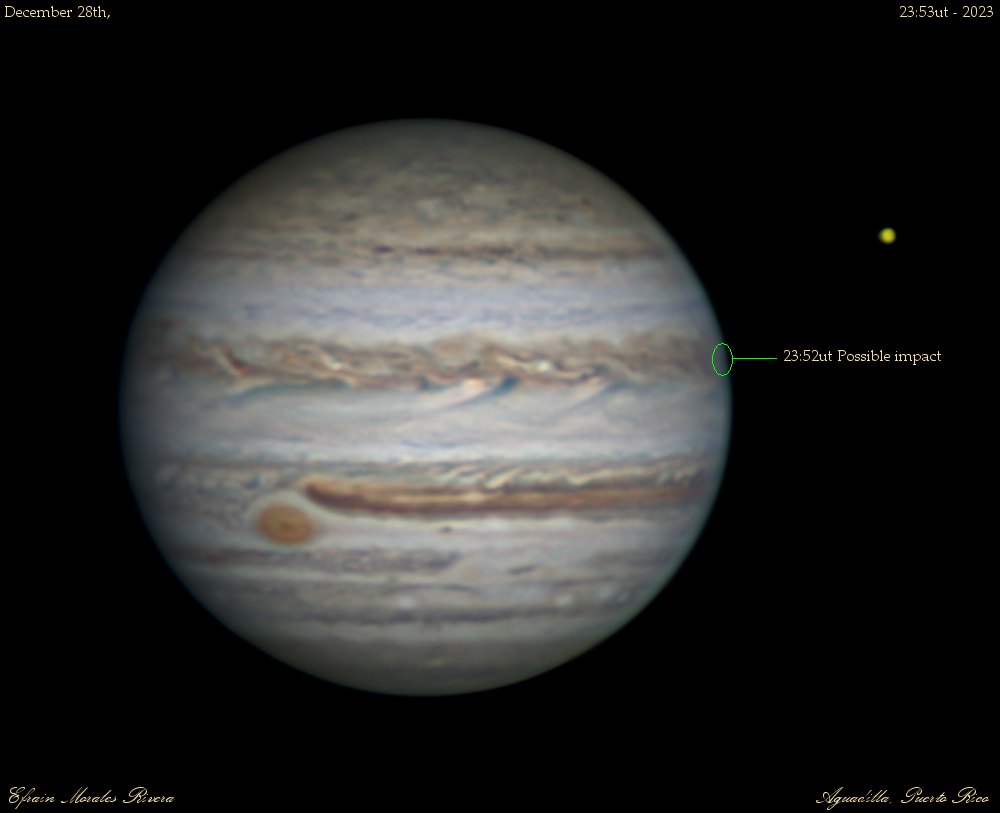
Impact on December 28, 2023. Status: Not yet confirmed with a video
Efrain Morales, who is an experienced observer from Puerto Rico, spot a bright flash in Jupiter on
December 28th around 23:52 UTC. Unfortunately, this was a visual detection on the screen on Efrain's computer, while he was preparing for an image session. The image on the right shows the potential location of the impact. A second report from Brazil with a visual detection too suggests this could be a real impact in Jupiter. If confirmed, this would have been the third impact on Jupiter observed this year. According to Efrain's visual impression of the impact, the bright flash of light on the limb of the planet could have been as bright as a star of magnitude 3 or 4. We encourage all observers who obtained Jupiter videos on
December 28th around 23:52 UTC to have a careful look at their video observations of Jupiter.
Observers wishing to obtain images of the impact location and search for a debris field can observe with methane band filters on the 349º-360º(System III) and planetographic latitude 12º.
Impact on December 29, 2023: Status: Video detection
Andrés Arboleda from Colombia observed a second impact on December 29, 2023 at approximate time 23:57-23:58UT. His video observation can be used to extract a light curve and measure the size of the impacting object. Further light curves from other observers are important to better constrain the nature of the impact.
Observers wishing to obtain images of the impact location and search for a debris field can observe with methane band filters on the 221º(System III) and planetographic latitude 30º.
IMPORTANT NOTE ON THESE IMPACTS: The fact that two impacts were reported so closely in time indicates possibilities for further impacts int he next few days. A preliminary image of the impact is shown on the right-most image.
2023-11-16
Japanese observers report a new impact flash in Jupiter. The impact was observed independently by
Kunihiko Suzuki,
Tsuyoshi Arakawa and
Kazuhiro Yamada on 15 November, 2023 at approximate times 12:41:15-12:41:32 UT. The impact was bright and clear with diffraction rings and diffraction spikes. This is the second impact in Jupiter discovered from Japan this year, showing the efficient survey carried by the large number of Japanese amateur observers.
You can check ALPO Japan for images by Tsuyoshi Arakawa and X(Twitter) of the different observers to see the videos of the impact.
2023-11-04
With Jupiter at opposition, and many northern hemisphere observers now getting superb high-resolution images, this month is an ideal time for an imaging effort that would, in particular, enable to
map the poorly-known flow patterns in the planet’s north polar region (NPR). Some of us made the first detailed study of this region last year [see
BAA 2022/23 report no.6], measuring drift rates of some features up to 76°N, and we hope that images this month can yield even better results.
Juno’s Perijove-56 is on Nov.22, and JunoCam should be able to get a good map of the planet, including about half the NPR at high resolution. Indeed, this may be JunoCam’s last best opportunity for such a global map, as the instruments will concentrate on very close Io flybys at PJ57 & PJ58, and the views of Jupiter may be less complete thereafter.
Therefore, observers who can take hi-res images that resolve details up to the polar regions are asked to do so especially during the period from Saturday Nov.11 to Saturday Dec.3. This is just a request to continue your normal imaging and reporting procedures but perhaps more intensively if you can. A campaign over 3 weeks is desirable to allow sustained tracking of high-latitude features and to allow for gaps due to unfavorable weather. And, of course, your images will also enable detailed study of all other regions of the planet, and will support any observations that professional astronomers may make for PJ56.
PJ56 itself is on Nov.22 with equator crossing at 12:36 (UT at spacecraft) at L3=136. The track will be on the night side, but imaging of it on Nov.22 could be valuable to give context for Juno’s other instruments such as the Microwave Radiometer. Juno’s best sunlit views of the NPR will be on the other side of the planet during its approach.
Clear and steady skies!
John Rogers (BAA)
Shinji Mizumoto (ALPO-Japan)
Glenn Orton (JPL)
Ricardo Hueso (Univ. del Pais Vasco)
Gianluigi Adamoli (JUPOS team)
Rob Bullen (JUPOS team)
Damian Peach (BAA)
2023-09-18
The
New Horizons NASA mission has organized ad Uranus/Neptune Observation Campaign with a explicit Request for Groundbased Amateur Observing Support.
NASA’s New Horizons spacecraft plans to observe Uranus and Neptune from its location in the outer solar system in September 2023, concurrently with the Hubble Space Telescope in Earth orbit. The New Horizons science team requests and welcomes observations of both of these ice giant planets from the global amateur astronomy community to enhance the science that the New Horizons and Hubble observations will produce.
Full information about this campaign is available at:
Uranus-Neptune-Observations
Images can be uploaded at:
https://filerequestpro.com/up/uranus_neptune-campaign
2023-08-29
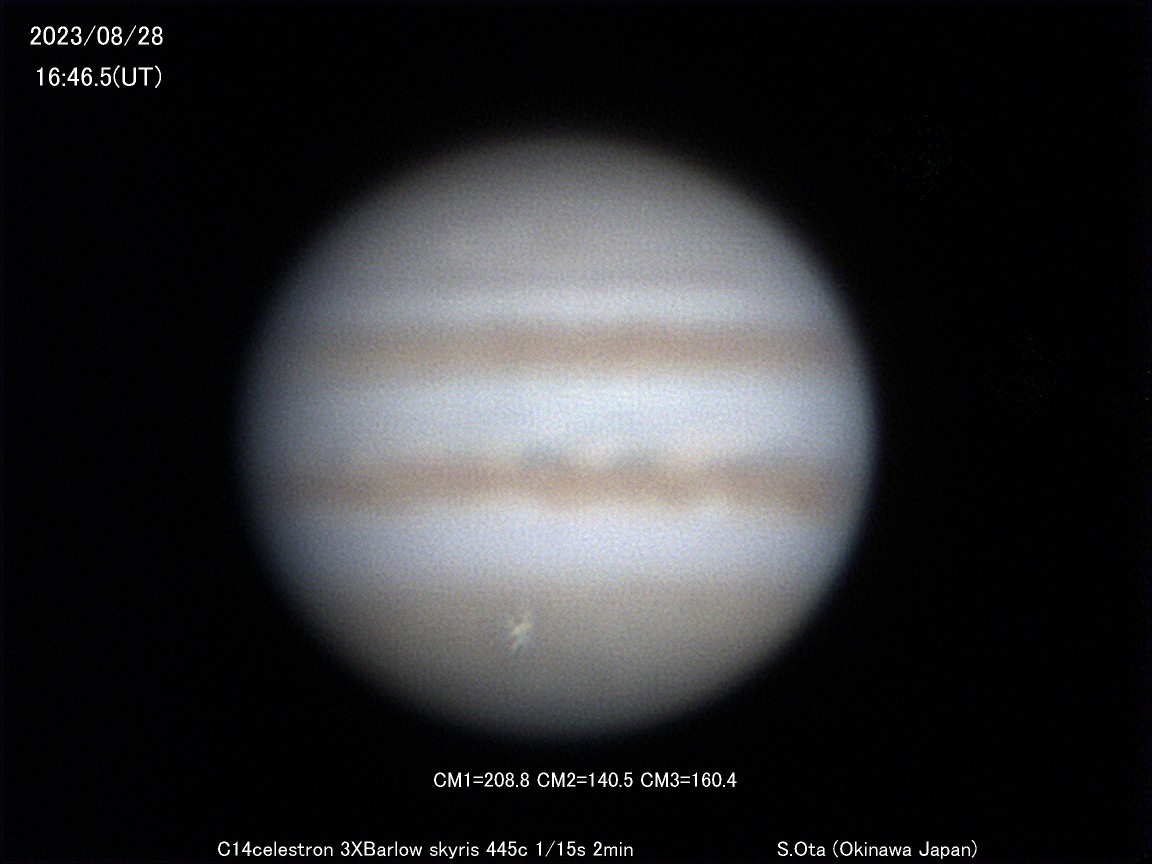
A new flash impact has been discovered in Jupiter's atmosphere. The discoverers of the impact are
Tsutomu Ishibashi and
Satoshi Ota who used a B390 filter and a color camera respectively. There is a third detection by a visual observer,
Mitsuharu Morita visually observing the impact on the monitor between shootings. Later, new reports from different observers have been comunicated through ALPO-Japan and X/Twitter. These include a third video detection by
Tadao Ohsugi, using a color camera,
Yasuaki Tomita using a monocrome camera, and
Masamichi Sekine also using a color camera. In addition, observers from China (
Liu Qiqi from Zhengzhou and possibly others) have captured data of the impact with reports on
X (Twitter). The image on the right is one of the frames in the video by Satoshi Ota. There are at least 7 independent observations of this impact, which makes this event one of the most widely observed impact flashes on Jupiter's atmosphere.
According to a first report circulated by
Issi Tabe, from
ALPO Japan, the impact occurred at 16:45:57 on August 28, 2023 with an impact position around L2 128° B″+45°.
Jupiter observers are encouraged to look at their video observations a few minutes around the impact to look for the flash and confirm this new impact with additional data that can constrain the size and energy released by the impacting body. The use of
DeTeCt is encouraged. Reports can be sent to Marc Delcroix, Ricardo Hueso and Isshi Tabe at the addresses:
- delcroix.marc at free.fr
- ricardo.hueso at ehu.eus
- isshi7717 at yahoo.co.jp
Methane-band images by observer Isao Miyazaki about 42 min after the impact do not show any impact scar on the planet confirming a small size of the body similar to previous flash impacts.
More information about the impact is currently available on:
2023-05-17
The small asteroid 2021 PH27 has the shortest orbital period of all
known asteroids with a perihelion of only 0.133 AU, and could be an active asteroid. Its orbit makes this asteroid to experience very close passes to Venus, where if active, could be the progenitor body of a venusian meteor shower. On
June 07, 2023 asteroid 2021 PH27 will pass at a minimum distance of Venus of 133,000 km offering a possible test towards its activity by producing a venusian meteor shower.
Detecting this meteor shower in Venus is a very low probability event, but amateur observers could attempt to detect flashes on Venus night-side on June 07 and June 08 with moderate exposure times (0.1-0.5 s). If a successful observation occurs it will be the first Venus meteor shower detected and it would also proof the suspected and not confirmed activity of asteroid 2021 PH27.
Dr. Javier Peralta (jperalta1 at us.es) leads part of the efforts to observe this potential meteor shower on Venus atmosphere. Observations can be analyzed with the software DeTect and communicated to Javier Peralta. Negative observations will also serve to characterize a threshold of activity on the asteroid.
References:
Carbognani et al. Is 2021 PH27 an active asteroid with a meteor shower detectable on Venus?, Monthly Notices of the Royal Astronomical Society: Letters, 511,L40–L44, https://doi.org/10.1093/mnrasl/slac004.
Arxiv version (public access to the publication)
2022-09-20
 Unique Jupiter opposition on 26th September 2022
: This year Jupiter opposition is the closest one in 70 years making Jupiter’s equatorial diameter as large as 49.9 arcsec as observed from Earth.
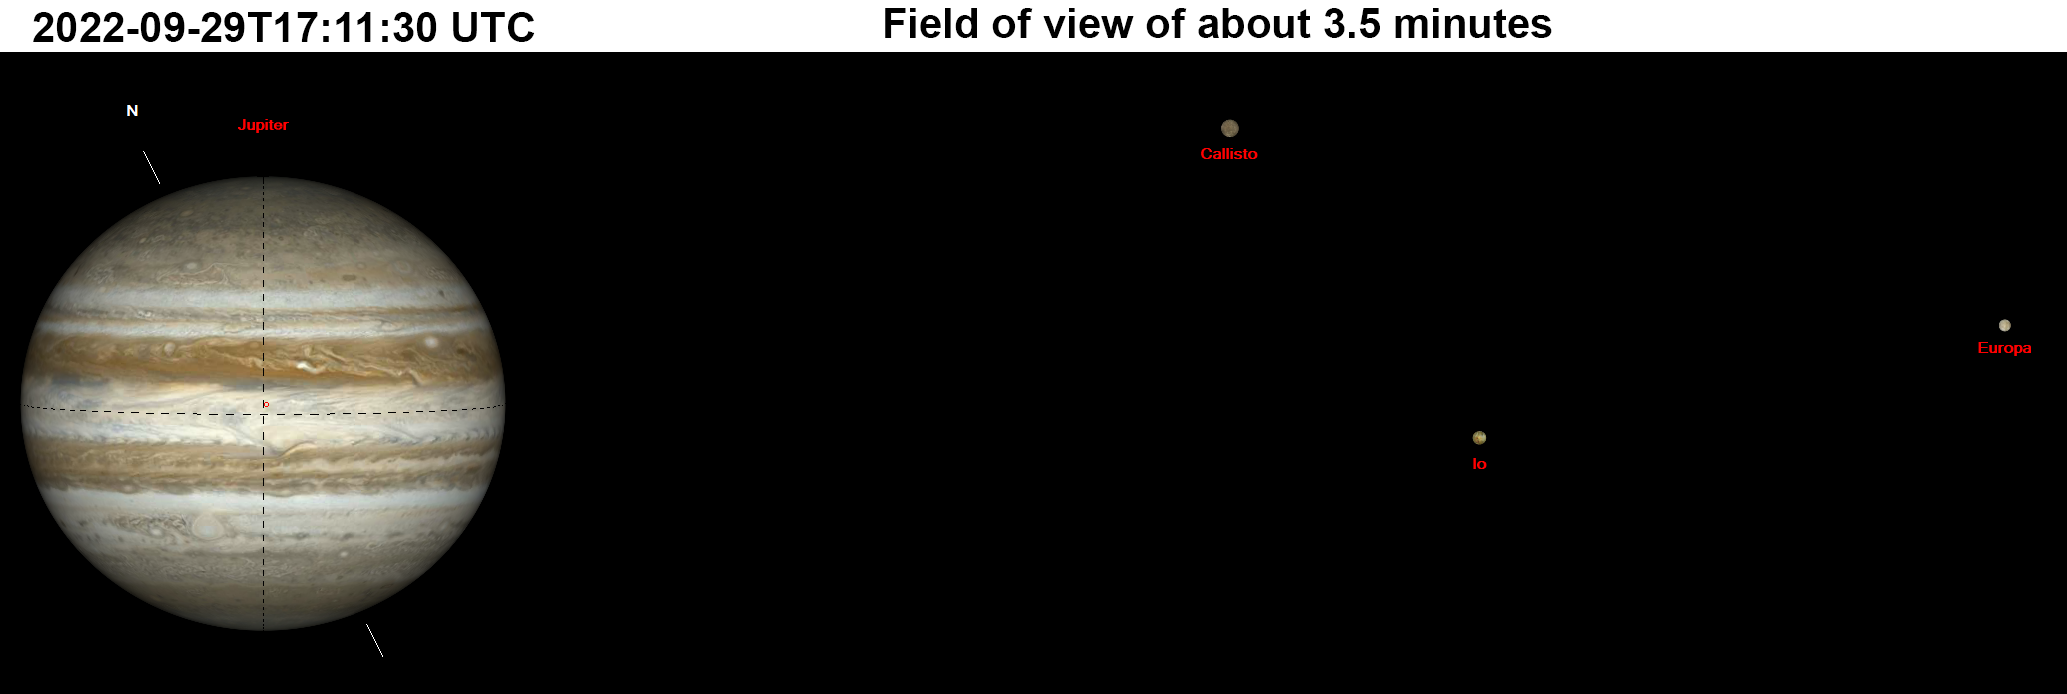
The opposition occurs on 26 September 2022. A few days later, the Juno mission will make its
45 Perijove of Jupiter on 29 September at 17:11:30 UTC. During this perijove Juno will perform a very close flyby of Europa at an altitude of only 320 km obtaining the most detailed observations of its surface from space. Europa will be a target of 1.1'' during those days close to opposition.
Amateur astronomers are invited to cover this perijove with observations of Jupiter and Europa with the added spatial resolution over Jupiter provided by the exceptional opposition and the possibly family portraits of the Jupiter system that can be obtained on those dates.
2022-05-28
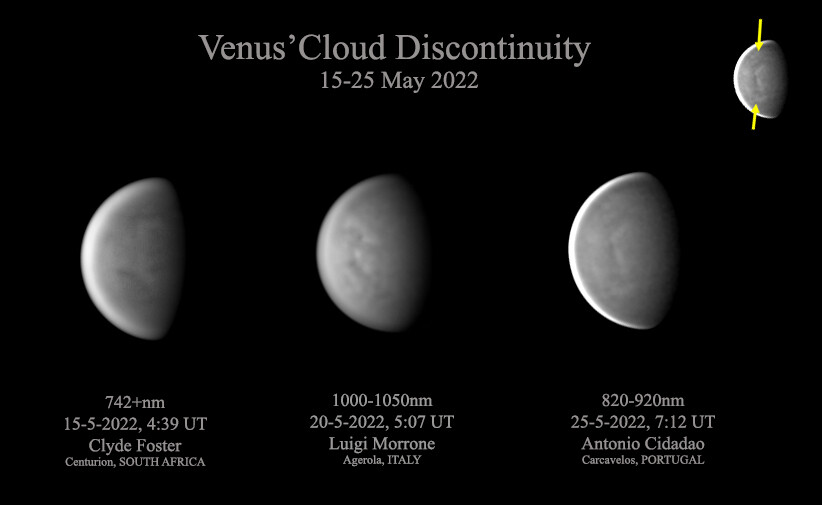
A large scale Cloud Discontinuity (CD) on Venus has been observed during the
last weeks by amateur astronomers Antonio Cidadao, Luigi Morrone and Clyde Foster. This type of events represent a peculiar morphology of Venus clouds discovered recently and tracked last year over amateur observations. This time, a clear manifestation of Venus' CD was captured 5 times during May 2022 (5-10-15-20-25). The next observation of this feature is expected on 30 May and every ~5 days after it.
It will be very interesting to see when it will dissipate, so observations with IR filters are required. Imaging in UV may be useful too to confirm whether this wave phenomenon dissipates before arriving at the top of the clouds. Also, it is very important to observe every day to cover the global situation of the middle clouds.
Observations should be posted in the ALPO-Japan webpages and in the PVOL database of amateur observations
(http://pvol.ehu.eus)
Javier Peralta from the Universidad de Sevilla (Spain) and Manos Kardasis (Greece) are coordinating a large effort to understand the global behavior of this feature.
Javier Peralta, jperalta1@us.es
Manos Kardasis, astromanos2002@yahoo.gr
Additional information:
2022-03-27
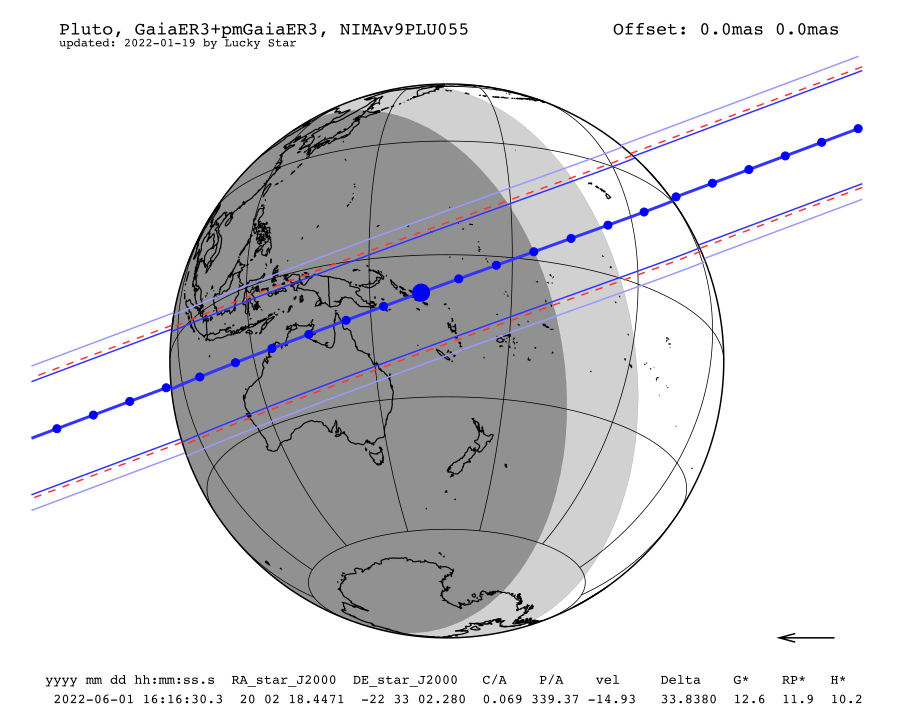 A stellar occultation by Pluto will occur on June 1, 2022
, and will be observable from the
South East Pacific at 16:16:30 UT. The map on the right contains information about the path of the shadow of Pluto over Earth's surface. Observations of this stellar occultation can help researchers to study the atmosphere of Pluto and its seasonal variation from comparison with data obtained by the NASA New Horizons spacecraft and previous occultations. In particular, observations obtained close to the center of the shadow, and requiring well located portable telescopes, will be very valuable to investigate the deeper layers of Pluto's atmosphere.
Important links
2021-10-16
 Ko Arimatsu
, from Kwasan Observatory, Kyoto University, reports on the discovery of a new impact in Jupiter. The impact occurred on 15 October 2021 at
13:24 UT and it was observed as a 2 seconds flash with a dual imaging system called PONCOTS.
You can see the original discoverer announcement at:
https://twitter.com/OASES_miyako/status/1449206637391007747 . You can see the video of the impact in visible light on this youtube link.
The impact occurred approximately at +20ºPg and 40º L3. This location will be possibly observed by JunoCam on the Juno mission on its PJ37 orbit later today!
If you have observations of this impact flash please report those to Ko Arimatsu, as well as R. Hueso and M. Delcroix by email to:
Ko Arimatsu: arimatsu.ko.6x ... AT ... kyoto-u.ac.jp
Ricardo Hueso: ricardo.hueso ... AT ... ehu.eus
Marc Delcroix: delcroix.marc ... AT ... free.fr
2021-09-14
 Marc Delcroix
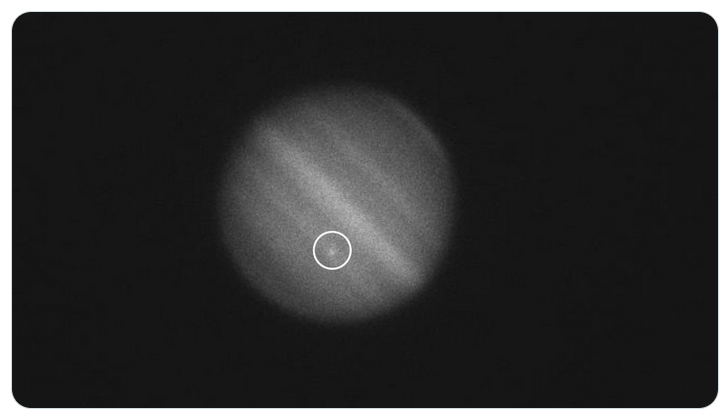
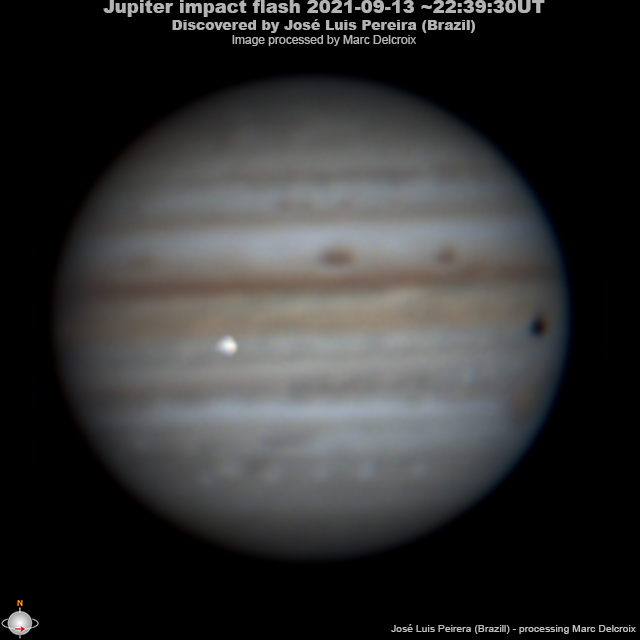
 alerts of a
Jupiter impact detection by
José Luis Pereira from Brazil.
TO ALL OBSERVERS: Check videos around 2021-09-13T22:39:30 UT to see if the video shows the flash of the impact. Additional videos will improve the study of the impacting body and will help to determine a good light-curve for this object desintegrating in Jupiter's atmosphere. Also CHECK images in CH4 band that you may have of the area after the impact and in the last Jupiter rotation .
PLEASE CONTACT US (Ricardo Hueso and Marc Delcroix) for analysis of data in case you have observed this area.
The impact detection by Jose Luis Pereira occured under bad weather conditions. Jose Luis decided to observe to look for impacts and used the software DeTeCt to check his videos. He did see something on screen while tweaking the parameters on hi first video, but thought it could be due to the very bad conditions with Jupiter even disappearing under the environment fog.
Sincere congratulations to Jose Luis Pereira for this great observation captured under difficult weather conditions!
You can check a GIF extracted from the video at Marc's site: http://astrosurf.com/planetessaf/doc/2021-09-13-2239_3-IRUV-Jup_F3275-3385%20qmax.gif, or here at PVOL:
http://pvol2.ehu.eus/pvolfiles/2021-09-13-2239_3-IRUV-Jup_F3275-3385 qmax.gif
2021-08-08
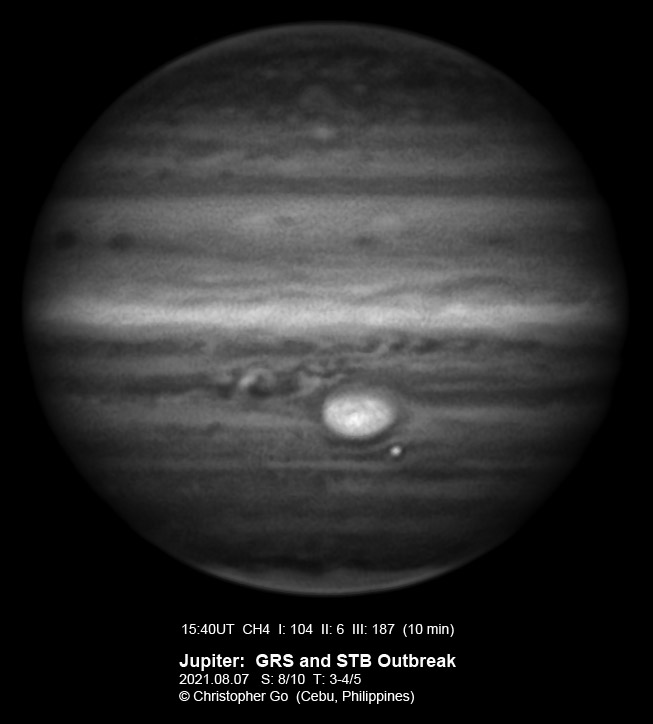
A new convective outbreak is developing in Jupiter's South Temperate Belt. A methane band image obtained on August 7th by
Christopher Go shows the outbreak similarly to last year
Clyde's spot. The storm has started in a small cyclone of the STB that has crossed below the Great Red Spot before starting a convective outbreak. This cyclone has showed high brigthness in the visible during the last few days and has been gaining in visibility before forming this convective eruption.
Observations in methane band are important in the first few days of activity. Observations in other filters will also be very helpful as the storm grows, dissipates and forms a disturbed cyclone with bright and dark structures. The short-term evolution is particularly important to understand differences and similarities with previous similar events.
2021-08-05
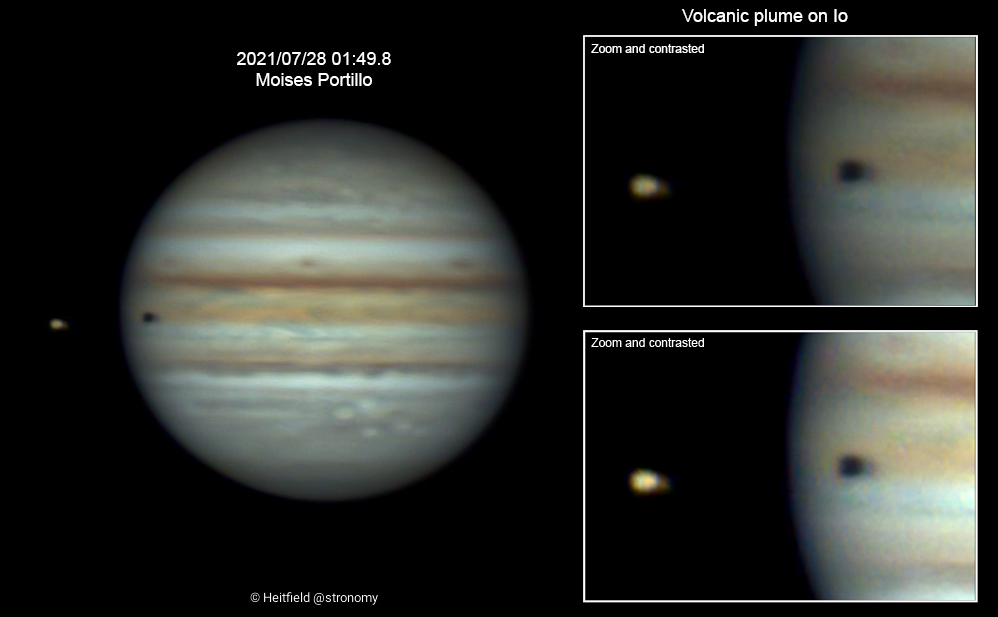 Jean-Luc Dauvergne
 from France reports the possible detection of a volcanic plume on Io attached to the Loki Patera region. The detection occurred on a series of images and videos obtained on 29 July 2021 at around 23:40 UT with a 300 mm telescope.
Moisés Portillo from Spain reports a similar event from a set of images obtained on 28 July at around 01:49 UT (see image on the right). This is probably the first detection of a volcanic plume on Io from ground-based telescopes (ground-based observations of Io with large telescopes monitor the volcanic activity through the detection of hot spots in the surface without resolving volcanic plumes).
Frank Marchis, an specialist on high-resolution imaging of Io reports that Io has been active since the month of April.
We encourage observers to look for possible additional detections of this plume in images of Io obtained close to 29 July and in recent observations.
Volcanic plumes are better detected on the blue channel than in red light because the light observed is diffused in the tenuous material of the plume. So, color observations that do not show the plume might be checked in its blue channel.
See Jean-Luc's images and his report on Astrosurf.
2021-08-04
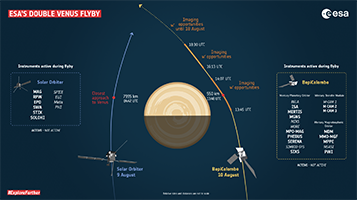 Solar Orbiter
 (ESA) and
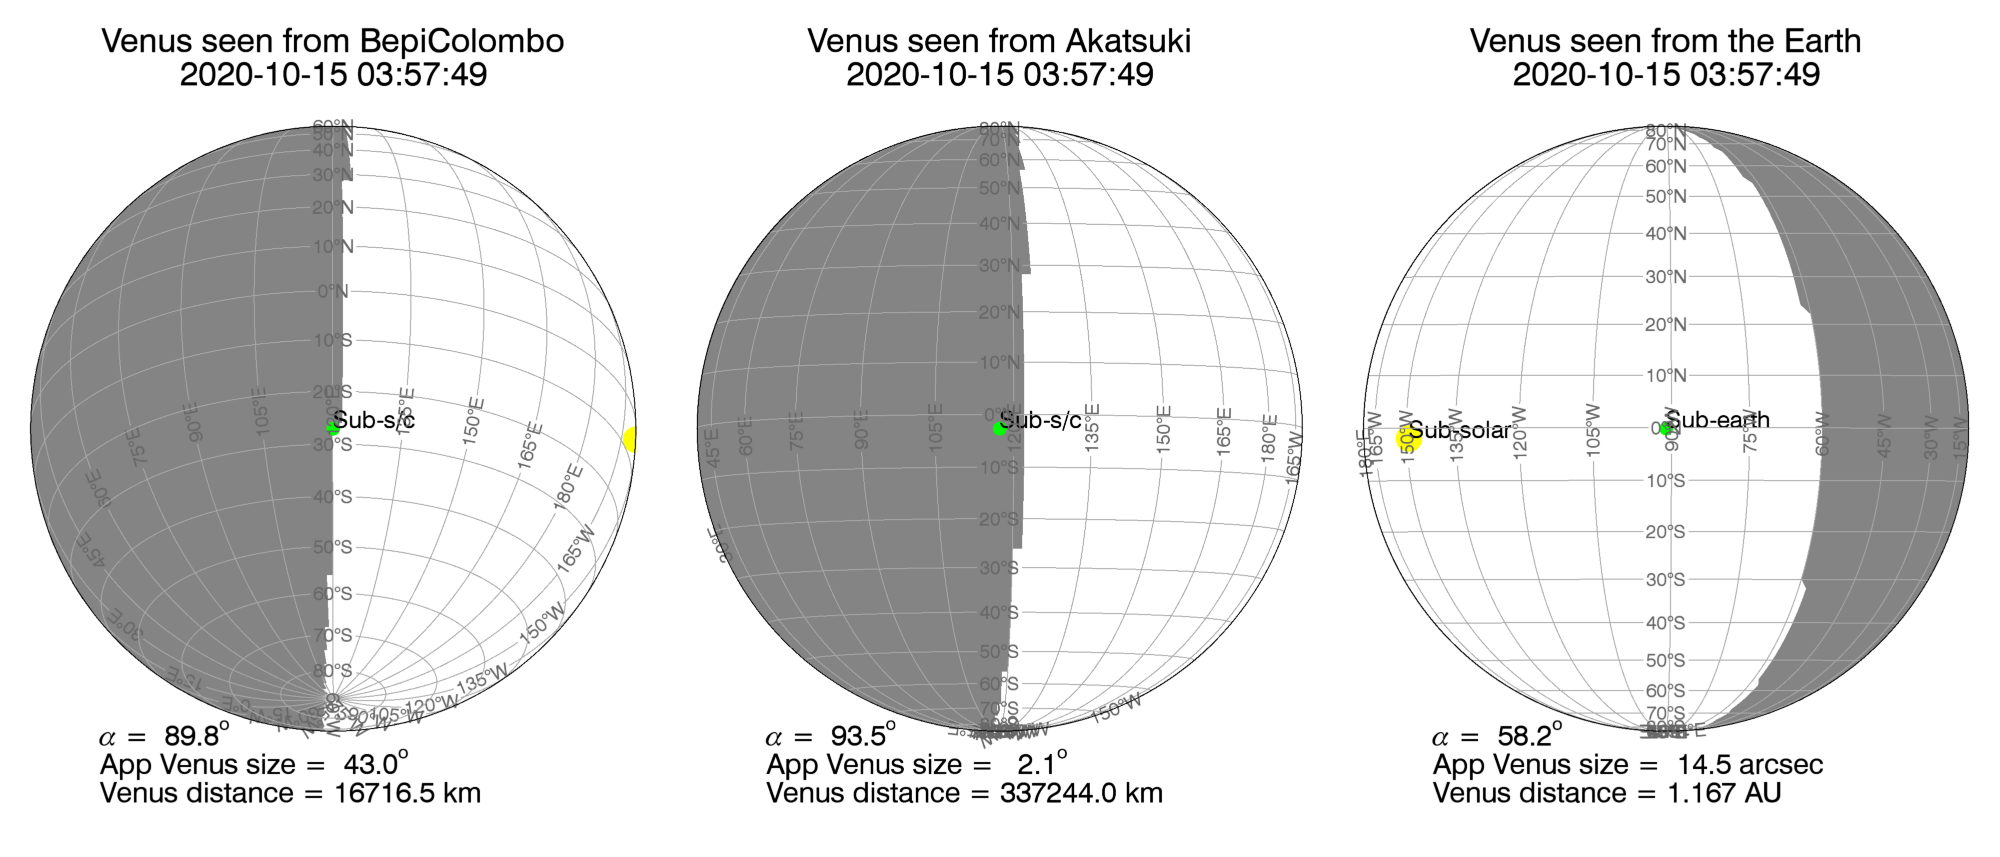
BepiColombo (ESA/JAXA) will make two Venus flybys on 9 and 10 August obtaining observations of Venus from multiple points in their approach to the planet. Venus will also be observed by the
Akatsuki orbiter (JAXA) and ground-based observatories. The closest approaches to Venus from these missions will be:
Solar Orbiter – closest approach ~7995 km at 04:42 UTC on 9 Aug
BepiColombo - closest approach ~550 km at 13:48 UTC on 10 Aug
Coverage of these two flybys will be through social media from ESA on Twitter: @Esaoperations @ESAsolarorbiter, @bepicolombo, @ESA_Bepi, @ESA_MTM and the first images of the flybys are expected to be released soon.
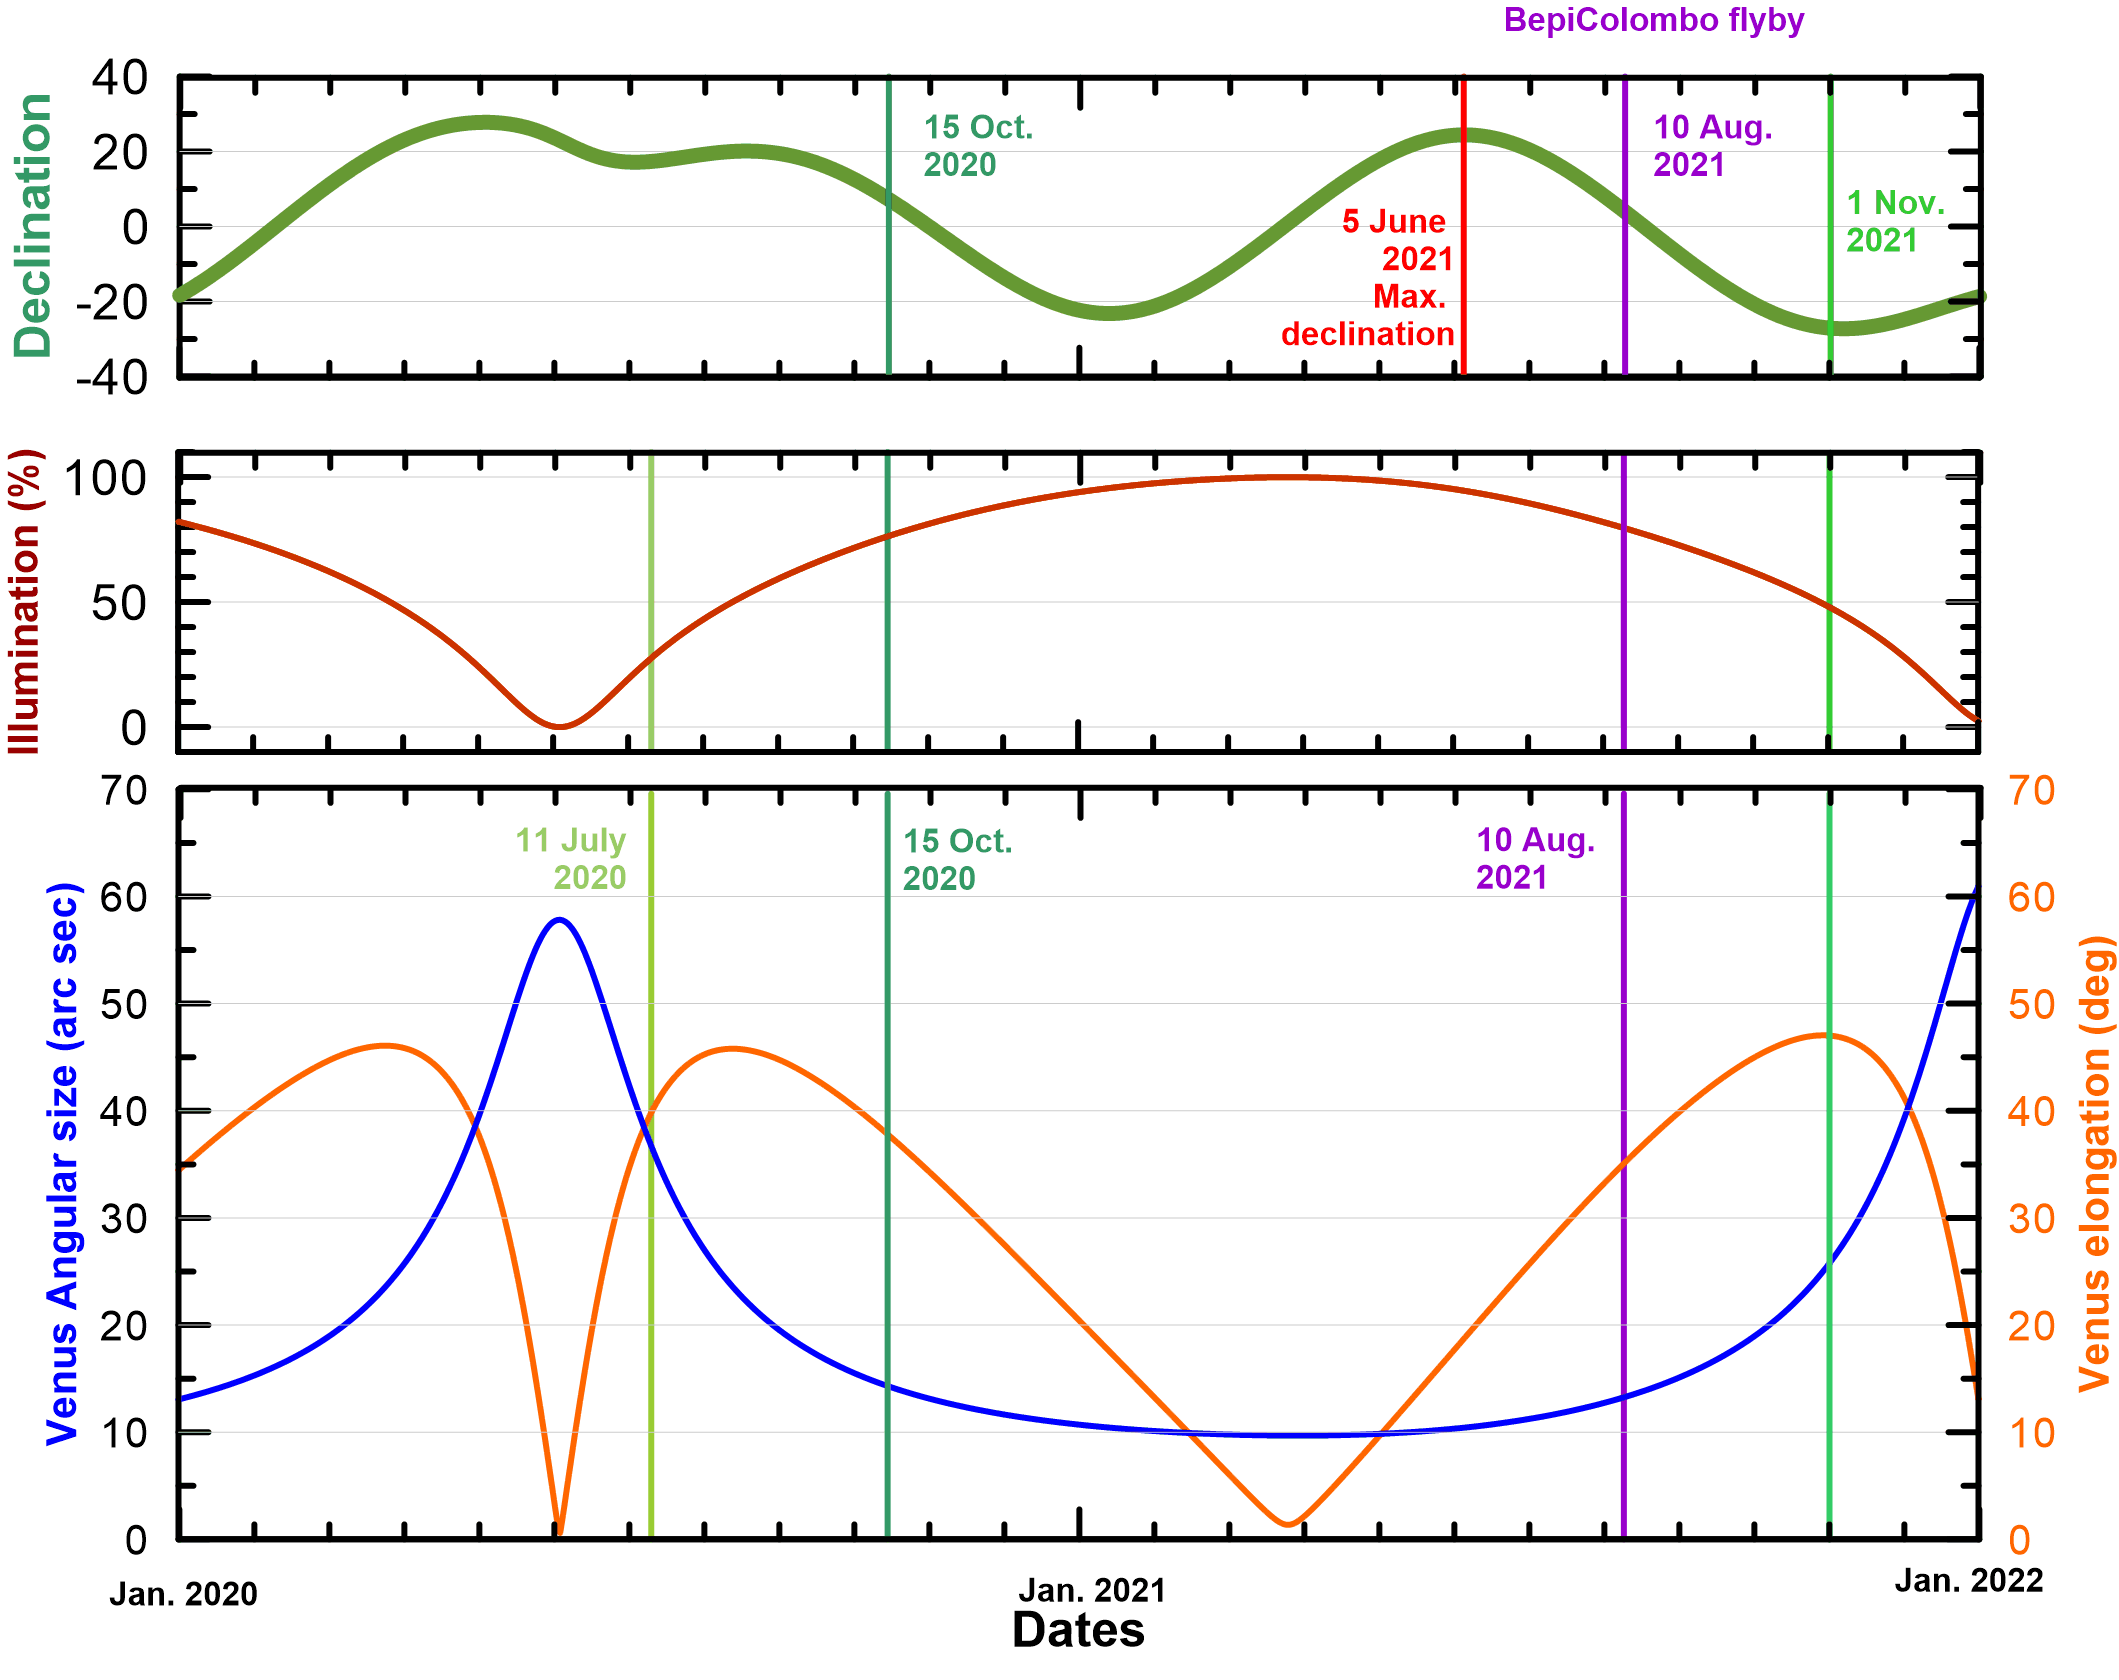
Amateur images of Venus through August to the maximum elongation of the planet are desired to maximize the return of these two flybys. You can check recent images of Venus in PVOL with noticeable cloud details on images by Luigi Morrone and Joaquín Camarena.
The figure on the right sketches the observing conditions of Venus from January 2020 to January 2022 with dates of the recent flybys by the Parker Solar Probe (11 July 2020), BepiColombo (15 October 2020) and the upcoming (9-10 August) Solar Orbiter and BepiColombo flybys. Although these flybys occur when Venus has a low elevation on the sky from most locations, Venus elongation continues to raise with maximum elongation close to 1 November 2021 favoring observers in the South hemisphere.
More information:
https://www.esa.int/Science_Exploration/Space_Science/ESA_gets_ready_for_double_Venus_flyby
http://pvol2.ehu.eus/bc/Venus/
2021-03-11
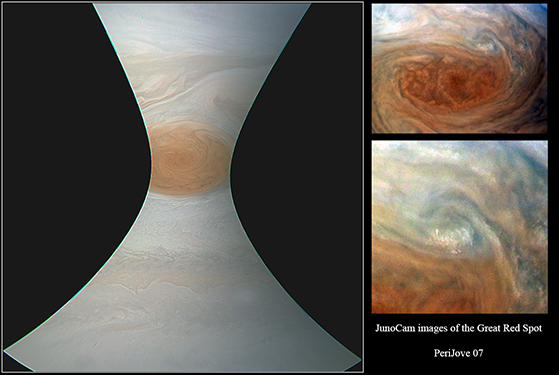
The largest collection of images in PVOL correspond to Jupiter observations obtained by amateur astronomers from all over the world. The Juno mission around Jupiter has provided the highest spatial resolution observations of the planet. The context of these observations comes many times from amateur observations and the Juno mission has stablished a large-scale collaboration with amateur astronomers and citizen scientists through the
JunoCam instrument (
PI: Candice Hansen, Planetary Sciences Institute) and the
https://www.missionjuno.swri.edu/junocam website. Now, to facilitate the comparison of these two very diverse datasets PVOL incorporates maps of Junocam images accesible through its search engine with the user "j unocam" or simply by date. The images in PVOL correspond to cylindrical maps of color images of Jupiter. Future updates of this dataset may incorporate observations in the methane band. A list of images at their glorious high spatial resolution is also available in PVOL at its
Junocam images tab in the upper menu.
The current data uploaded into PVOL incorporates RGB observations from Juno's perijoves 3 to 11 and a new perijove will be uploaded with a cadence of one per week approximately.
Mapping of these images and their incorporation in PVOL has been possible thanks to the project Europlanet 2024 RI and the scientific collaboration with Drs. Candice Hansen (LPI) and Glenn S. Orton (JPL).
2021-02-09
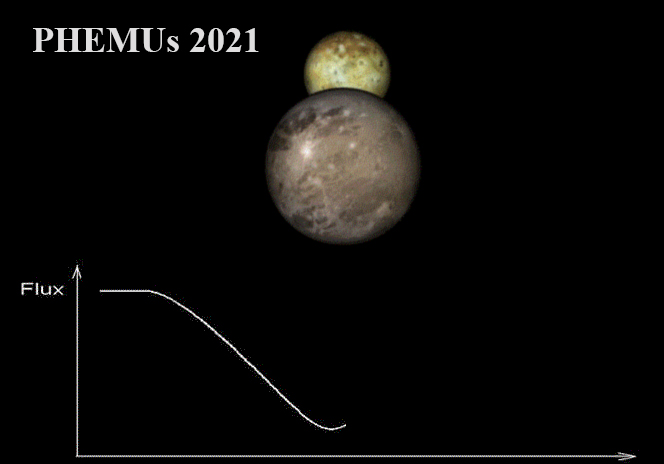 In 2021 Jupiter will be edge-on to the Sun and Earth (with equinox on May 2). This geometry will allow the observations of several mutual phenomena ("phemus" from phénomenes mutuelles in French) of the galilean moons (transits, and eclipses between the galilean moons) resulting in hundreds of events. These kind of events occur over a broad period of time of less than a year separated by 6 Earth years to the previous and next epochs of Phemus.
The IMCCE (Institut de mécanique céleste et de calcul des éphémérides) has initiated an observing campaign with predictions of the timings of the events available at
https://www.imcce.fr/recherche/campagnes-observations/phemus/phemu#. The webpage contains information about the tips for observations of the events and tools. Detailed events can inform about the details of the orbits of the satellites and gravity effects on them improving our knowledge of the Jupiter system.
Detailed ephemerides of the events are also available at: http://nsdb.imcce.fr/multisat/nsszph517he.htm.
You can also plan your observations with visualisations of the events using WinJUPOS (Tools > Ephemerides > Graphics). John H. Rogers, from the BAA indicates that some of the events listed by IMCCE are actually behind Jupiter or in its shadow and are not observable and using WinJupos in advance can be a good idea towards a successful plannification of the observation.
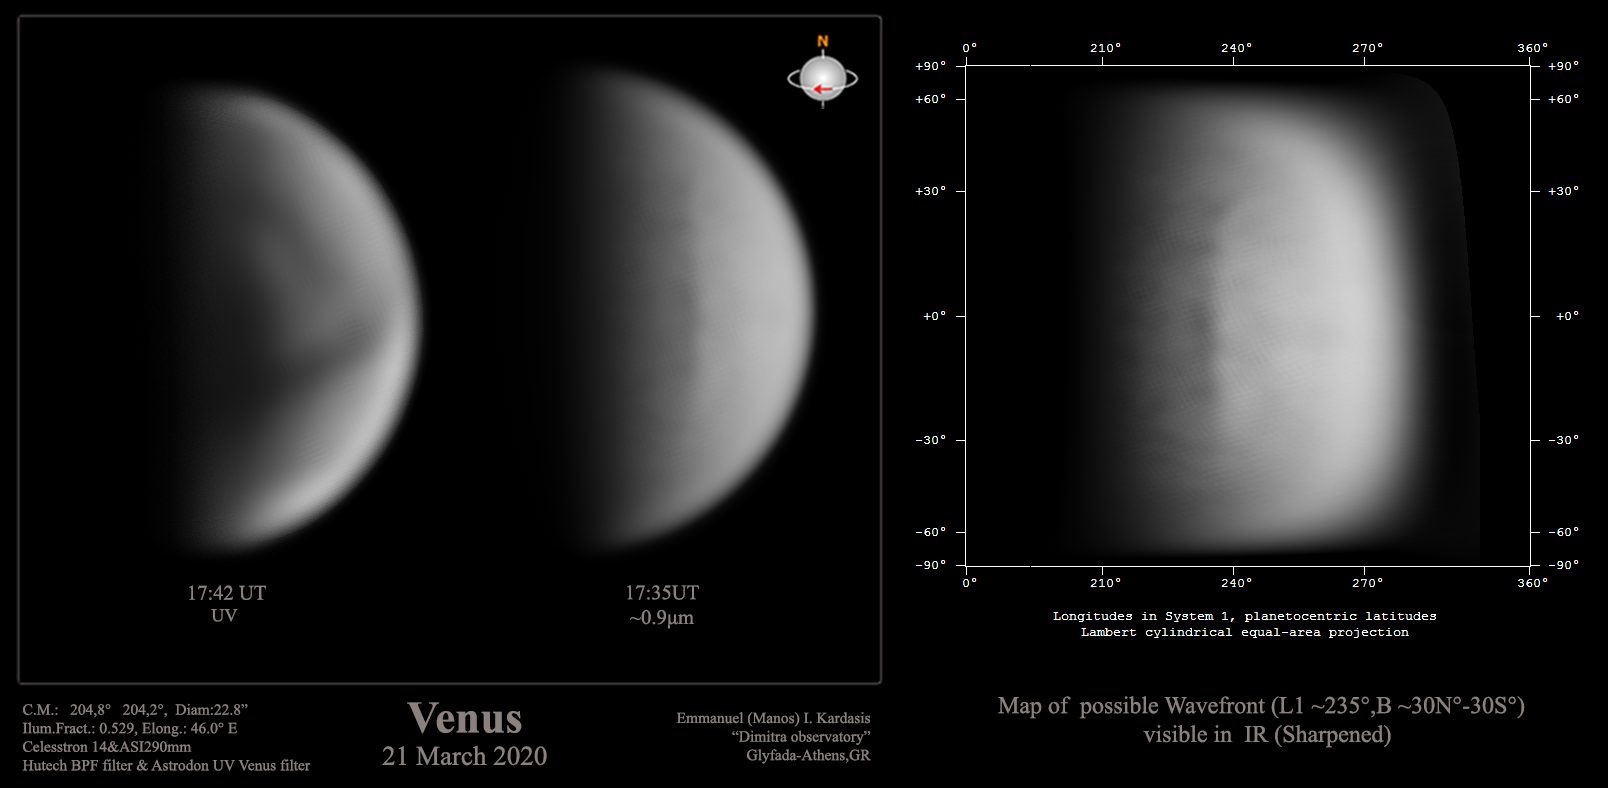
2020-10-13
 The ESA/JAXA mission BepiColombo will flyby Venus on 15 October at an altitude of 10,720 km above Venus surface. It will observe the planet from 13 October to 17 October with a closest approach on 15 October at 03:58 UT. This will be the first of two flybys to Venus, with the second one scheduled for 10 August 2021 at a very close altitude of 550 km. We would like to invite you to get Venus observations over these days and up to October 21 with emphasis on the closest approach of 15 October. Venus cloud tops observable in the UV rotate around the planet once every 4 days and observations from 11-12 October will characterize the details observable at the time of the closest flyby on 15 October. Observations on 19-20 will be able to characterize the next rotation. Long infrared filters (IR810, methane filters and 1000nm) can be used to study the dynamics of lower levels of the clouds where the atmosphere rotates once every 5 days and where large structures recently discovered and not yet fully understood can be observed (see for instance the following
observations from Manos Kardasis from March 2020.)
The ESA/JAXA mission BepiColombo will flyby Venus on 15 October at an altitude of 10,720 km above Venus surface. It will observe the planet from 13 October to 17 October with a closest approach on 15 October at 03:58 UT. This will be the first of two flybys to Venus, with the second one scheduled for 10 August 2021 at a very close altitude of 550 km. We would like to invite you to get Venus observations over these days and up to October 21 with emphasis on the closest approach of 15 October. Venus cloud tops observable in the UV rotate around the planet once every 4 days and observations from 11-12 October will characterize the details observable at the time of the closest flyby on 15 October. Observations on 19-20 will be able to characterize the next rotation. Long infrared filters (IR810, methane filters and 1000nm) can be used to study the dynamics of lower levels of the clouds where the atmosphere rotates once every 5 days and where large structures recently discovered and not yet fully understood can be observed (see for instance the following
observations from Manos Kardasis from March 2020.)
We warmly invite you to get observations that will help us characterize motions, cloud morphology and changes in Venus cloud fields over the time scale of 2-3 rotations around the planet (8-13 days). Some of you have obtained fantastic observations of Venus surface with combinations of filters close to 1 micron isolating the narrow bands at 1.0, 1.05 and 1.1 microns where the surface becomes observable. Such observations are also highly welcomed.
BepiColombo will observe Venus thermal emissions from 7 to 14 microns obtaining global images of the temperatures at the cloud tops and above the clouds and will obtain detailed spectroscopy in the UV from 145 to 315 nm. Images in the UV and 10 microns (also reflecting thermal properties of the atmosphere at the upper clouds and above) will be obtained by the Akatsuki orbiter. The amateur contribution might provide most of the temporal context of the cloud fields to the BepiColombo spectra and will be very valuable to the mission.
More information:
2020-09-18
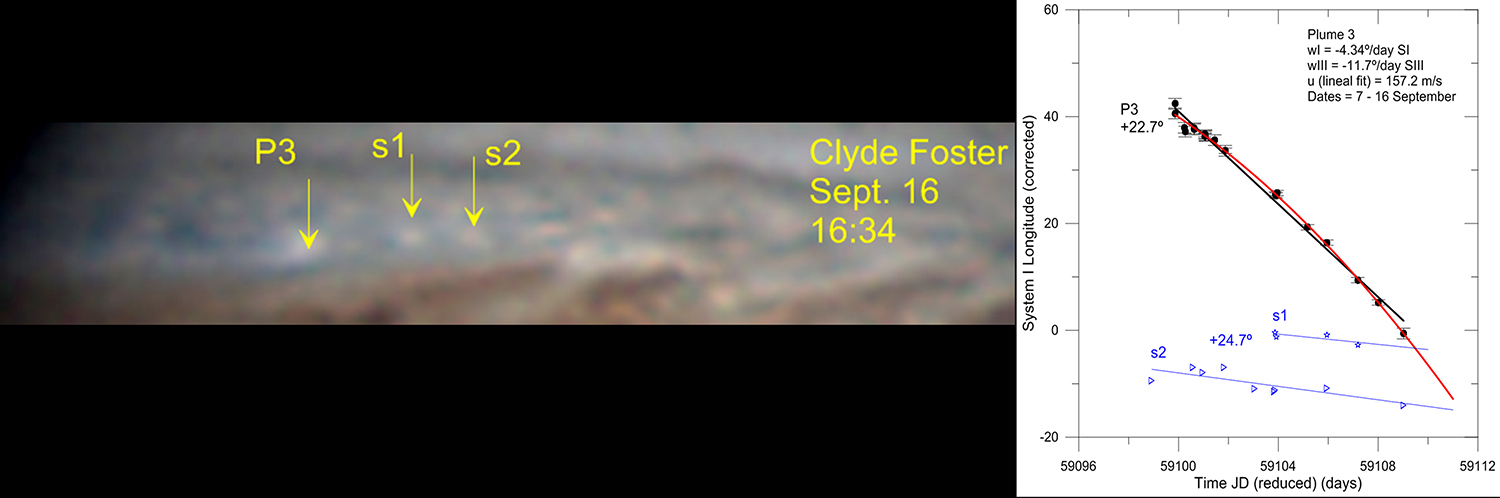 According to the last Jupiter images by Clyde Foster on 16 September, plume P3 has speed up and is approaching two white spots (s1 and s2) located at a latitude further north.
Interactions between plume P3 and these white spots may be imminent according to the drift of the futures.
According to the last Jupiter images by Clyde Foster on 16 September, plume P3 has speed up and is approaching two white spots (s1 and s2) located at a latitude further north.
Interactions between plume P3 and these white spots may be imminent according to the drift of the futures.
URGENT OBSERVATIONS of this region are needed to study this interaction. Previous large-scale disturbances in the NTB resulted in the plumes being switched off by their complex turbulent interaction with the tails of other plumes.
2020-08-18
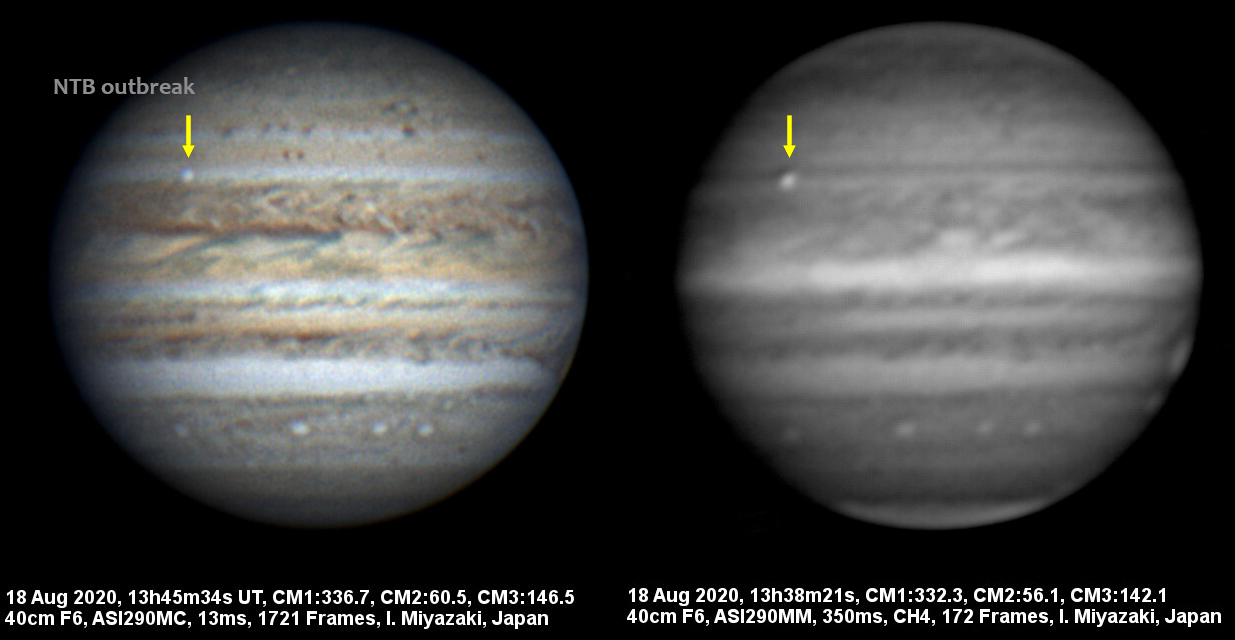 Isao Miyazaki and John Rogers report on a new very bright spot in the NTropZ visible in images acquired by Isao Miyazaki on 18 August 2020. The storm is visible as a bright spot in visible wavelengths and is very bright in methane band images. This storm is the start of a new outbreak in the NTBs jetstream. Such convective storms produce NTB Disturbance in a regular cycle with the current event occurring one year ahead of the expected timeline.
Observations at all wavelengths and methane band of all longitudes of the planet are required to monitor the NTB. The outbreaks in the NTB are generally multiple with outbreaks separated in longitude tens of degree and initiated with time differences of one to a few Jupiter rotations.
The drift rate of the initial disturbance is -12.2 +/- 0.1 º/day (system III) at 22.9+/-0.5º (Pg). The plume moves at 165 m/s at 22.9º (pg) just a bit south to the NTB peak jet which in 2016-2017 had a peak velocity of 150 m/s. This means that, as predicted from observations of previous events, the convective disturbance moves faster than the zonal winds with the typical behavior of previous disturbances in the NTB.
We would like to encourage observers to observe ALL LONGITUDES in Jupiter combining visible or IR with methane band images. All previous similar disturbances produced different convective plumes in different longitudes. It is very important to catch the initial convective disturbance in its first 2 Jupiter rotations to acquire a quantitative measurement of its initial growth rate which is directly related with the enery released.
Updated ephemeris (based on tracking from 18 to 21 August) for the first plume are given below but please keep observing all other longitudes for the start of the next disturbances.
 ----------------------------------------------------------------------------------------------------------------------------------------
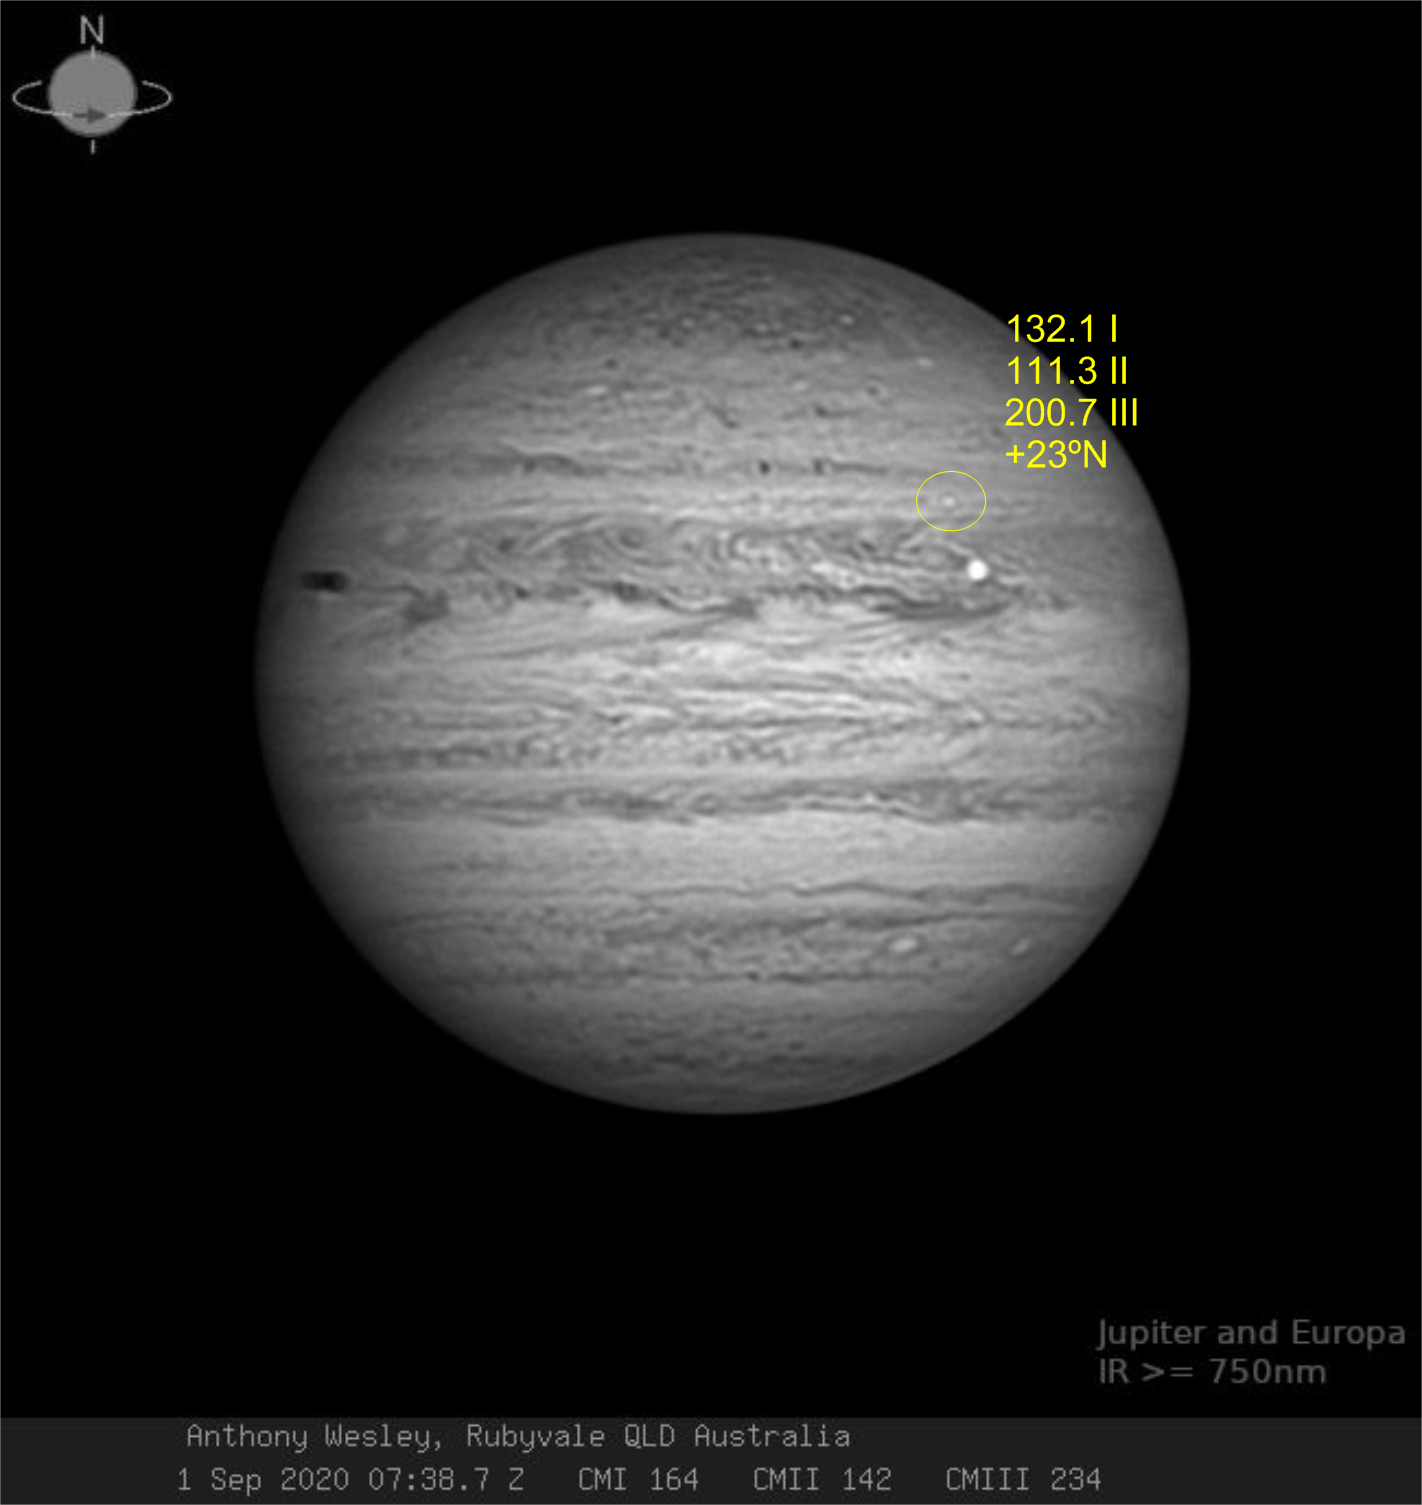
UPDATE 03 September: A second convective outbreak has appeared on Jupiter and first imaged on 01 September
by Anthony Wesley
and on 02 September by Eric Sussenbach.
The new outbreak drifts similarly to the first outbreak with a drift rate of -11.6º/day and initial position as posted on the right image.
Ephemeris will be posted shortly.
----------------------------------------------------------------------------------------------------------------------------------------
--- EPHEMERIS FOR THE FIRST OUTBREAK ---
WinJUPOS 11.1.0 (Jupiter), C.M. transit times, 2020/08/28  19:14
Object longitude: L3 = 177,3° - 12,2000°/d * (T - 2020 Aug 18,5)
Time interval: 2020 Aug 16,0 ... 2020 Sep 16,0
Output format: Date UT (C.M. of System 3)
------------------------------------------------------------------------------
2020 Aug 16   03:51 ( 206°)   13:38 ( 201°)   23:25 ( 196°)
2020 Aug 17   09:13 ( 191°)   19:00 ( 186°)
2020 Aug 18   04:47 ( 181°)   14:34 ( 176°)
2020 Aug 19   00:22 ( 171°)   10:09 ( 166°)   19:56 ( 161°)
2020 Aug 20   05:43 ( 156°)   15:31 ( 151°)
2020 Aug 21   01:18 ( 146°)   11:05 ( 141°)   20:52 ( 136°)
2020 Aug 22   06:40 ( 131°)   16:27 ( 126°)
2020 Aug 23   02:14 ( 121°)   12:02 ( 117°)   21:49 ( 111°)
2020 Aug 24   07:36 ( 106°)   17:23 ( 101°)
2020 Aug 25   03:11 (  97°)   12:58 (  92°)   22:45 (  86°)
2020 Aug 26   08:32 (  81°)   18:20 (  77°)
2020 Aug 27   04:07 (  72°)   13:54 (  66°)   23:41 (  61°)
2020 Aug 28   09:29 (  57°)   19:16 (  52°)
2020 Aug 29   05:03 (  46°)   14:51 (  42°)
2020 Aug 30   00:38 (  37°)   10:25 (  32°)   20:12 (  26°)
2020 Aug 31   06:00 (  22°)   15:47 (  17°)
2020 Sep 01   01:34 (  12°)   11:22 (   7°)   21:09 (   2°)
2020 Sep 02   06:56 ( 357°)   16:43 ( 352°)
2020 Sep 03   02:31 ( 347°)   12:18 ( 342°)   22:05 ( 337°)
2020 Sep 04   07:53 ( 332°)   17:40 ( 327°)
2020 Sep 05   03:27 ( 322°)   23:02 ( 312°)
2020 Sep 06   08:49 ( 307°)   18:36 ( 302°)
2020 Sep 07   04:24 ( 297°)   14:11 ( 292°)   23:58 ( 287°)
2020 Sep 08   09:46 ( 282°)   19:33 ( 277°)
2020 Sep 09   05:20 ( 272°)   15:08 ( 268°)
2020 Sep 10   00:55 ( 262°)   10:42 ( 257°)   20:29 ( 252°)
2020 Sep 11   06:17 ( 248°)   16:04 ( 242°)
2020 Sep 12   01:51 ( 237°)   11:39 ( 233°)   21:26 ( 227°)
2020 Sep 13   07:13 ( 222°)   17:01 ( 218°)
2020 Sep 14   02:48 ( 213°)   12:35 ( 207°)   22:23 ( 203°)
2020 Sep 15   08:10 ( 198°)   17:57 ( 193°)
------------------------------------------------------------------------------
Additional information can be found on the preliminary report by the BAA, and a second ellaborate report.
----------------------------------------------------------------------------------------------------------------------------------------
UPDATE 08 September: David Hamilton
from Puerto Rico has obtained a clear view of a 3rd outbreak in the
NTB at L2 approximately 324. A possible previous observation by Andy Casely
2 rotations before and by Cory Schmitz will serve to constrain the first stages of this new storm. New observations of this 3rd outbreak are needed.
----------------------------------------------------------------------------------------------------------------------------------------
2020-07-03
The Parker Solar Probe (NASA) and BepiColombo (ESA) missions will flyby Venus on July 11th and October 15th.
Both missions will obtain observations of Venus coordinated with the Akatsuki mission (JAXA),
currently in a long eliptic orbit around the planet.
Researchers on Venus atmosphere are using this opportunity to launch a large ground-based
support campaign of these missions and the participation of amateur observers can be fundamental
to provide enough data of the Venus atmosphere with context observations in July, August and October.
We have launched a campaign to provide amateur support to these flybys and we are actively requesting Venus observations.
See the Venus amateur campaign at: http://pvol2.ehu.eus/bc/Venus/
All Venus observations submitted to PVOL will be used for this campaign.
2020-05-31
 Clyde Foster from South Africa reports on the apparation of a bright storm in Jupiter in the South Temperate Belt. The storm suddenly appeared as a bright compact spot South East of Jupiter's Great Red Spot on images acquired on 31 May 2020 at around 00:34 UT. While the storm is observable in most wavelengths, it is particularly well contrasted when using filters in the methane band at 890 nm where high clouds appear bright. As other convective storms its location is in a cyclonic region.
Andy Casely from Australia obtained methane maps of the area one Jupiter rotation earlier confirming the sudden apparition of the storm.
Clyde Foster from South Africa reports on the apparation of a bright storm in Jupiter in the South Temperate Belt. The storm suddenly appeared as a bright compact spot South East of Jupiter's Great Red Spot on images acquired on 31 May 2020 at around 00:34 UT. While the storm is observable in most wavelengths, it is particularly well contrasted when using filters in the methane band at 890 nm where high clouds appear bright. As other convective storms its location is in a cyclonic region.
Andy Casely from Australia obtained methane maps of the area one Jupiter rotation earlier confirming the sudden apparition of the storm.
Fast observations of Jupiter are requested to follow the evolution of this storm that could grow into a larger disturbance similar to the South Temperate Belt Disturbance developed in February 2018.
The storm is located at longitude 24º (System III) and planetographic latitude -33º. Juno will observe this specific area in 2 days but ground-based images in this period can help to measure the intensity of the convection in this storm. Previous similar storms have developed with different convective cores activating very closely on different days over the first 3-4 days of activity.
2020-03-31
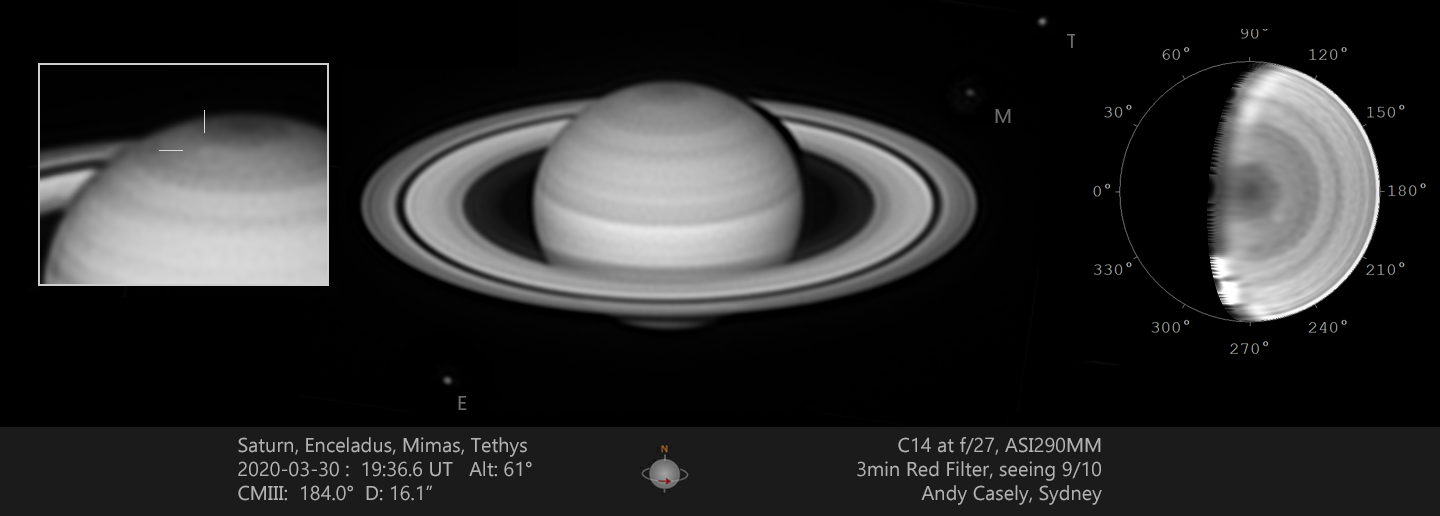 Andy Casely from Australia reports on the apparition of a well-defined bright spot at high latitude on Saturn at L3 224deg/+71deg first observed on 30 March 2020. This could be a revival of the system of storms observed over most of 2018, which also produced several features observed over 2019. Previous observations by Clyde Foster in South Africa and Trevor Barry in Australia allow to calculate a preliminar set of ephemeris to help with new observations of this storm.
Fast observations of Saturn are requested to investigate the dynamics of this possible storm and the general state of Saturn's polar atmosphere.
The image on the right has been edited for visualization purposes. You can see Andy's original observation on his Google photos webpage.
2019-08-07

An amateur astronomer: Ethan Chappel from Cibolo, Texas, US observed a bolide impact with Jupiter. The approximate time of the impact was 2019-08-07 04:07 UTC. Ethan captured his video on the red channel with a C8, Chroma Red filter and ASI 290MM. The image on the right was produced by the DeTecT software that uses differential photometry images of a video to look for possible impacts in the planet.
Congratulations to Ethan on this discovery.
Observers from the American continent observing the planet at the same time may have got also a video observation of the same impact. If anyone has a second detection it would help to constrain the size and mass of the object, specially if the second detection was made with a different filter. The flash seems too small at present to have caused an impact scar. The flash was recorded at approximate coordinates: 10.0º (System III) and -19.0 (Pg). This is about 60 deg west of Jupiter's GRS. A search on images acquired over the next minutes/hours of the same region might be worthy. An impact scar is unlikely though.
2019-05-22
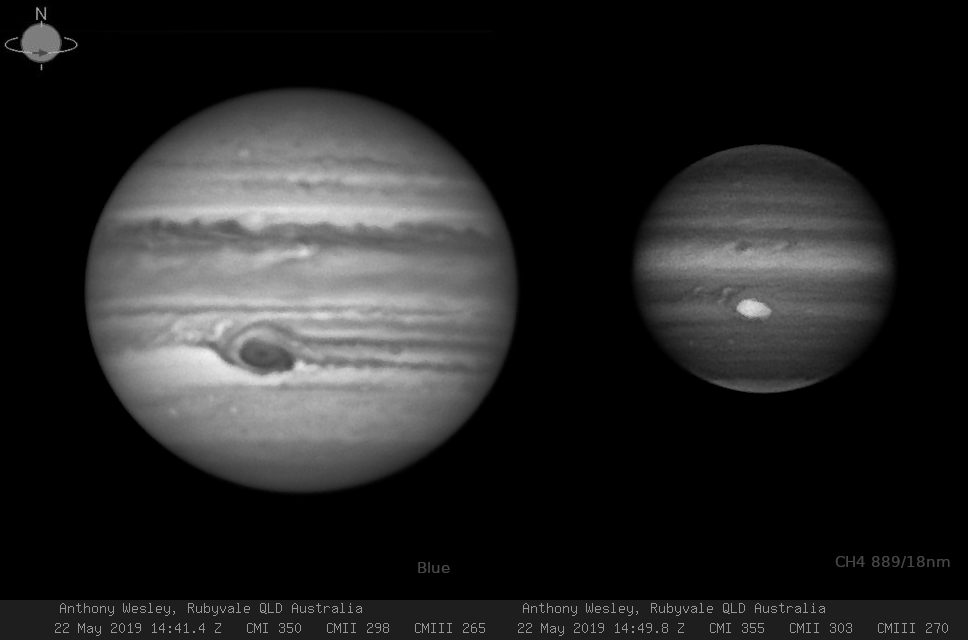 Observations over the last couple of years have shown discrete events of red material flowing apart from the GRS. This activity has increased over 2019 and recent observations obtained by several amateurs including notable images by A. Wesley and C. Foster show "flakes" outside of the GRS and a distorted shape.
Observations on May 22 show a very distorted GRS in blue and methane band filters that indicate an intensification of this recent activity. The images on the right were obtained by Anthony Wesley.
Observations are requested to monitor this activity. Red, Blue and methane band filters are required to investigate the nature of the behavior of the GRS. Frequent observations are needed as the activity is evolving on a daily basis.
Ephemeris of the GRS transits on the Central Meridian of the planet can be found here
2019-05-14
Marc Delcroix has released a new version of the DeTeCt software to find look for impacts in video observations of Jupiter and Saturn. The new software can be downloaded from its
github page or from the
jovian impacts section in PVOL.
2018-10-28
Recent observations by
Blake Estes acquired on 22 October 2018 using the 60'' Mount Wilson telescope show a bright cloud feature at the border of the bright polar hood. This storm has now been observed by other amateur astronomers and is visible in some observations obtained with large telescopes.
Marc Delcroix has studied the amateur images and has provided the ephemeris bellow. Note that this is the first storm observed in Uranus by amateurs since 2014 and that the professional community would highly wellcome new observations of this feature. Observations with non narrow IR filters like the 610, 685 and 742 nm are recommended.
WinJUPOS 10.3.11 (Uranus), C.M. transit times, 2018/11/14  10:06
Object longitude: L = 270,0° - 24,7470°/d * (T - 2018 Oct 09,5)
Output format: Date UT (C.M. of System 1)
------------------------------------------------------------------------------
2018 Nov 01   12:48 (  60°)
2018 Nov 02   05:14 (  43°)   21:39 (  26°)
2018 Nov 03   14:05 (   9°)
2018 Nov 04   06:31 ( 352°)   22:57 ( 335°)
2018 Nov 05   15:22 ( 318°)
2018 Nov 06   07:48 ( 301°)
2018 Nov 07   00:14 ( 285°)   16:40 ( 268°)
2018 Nov 08   09:05 ( 250°)
2018 Nov 09   01:31 ( 234°)   17:57 ( 217°)
2018 Nov 10   10:23 ( 200°)
2018 Nov 11   19:14 ( 166°)
2018 Nov 12   11:40 ( 149°)
2018 Nov 13   04:06 ( 132°)   20:32 ( 115°)
2018 Nov 14   12:57 (  98°)
2018 Nov 15   05:23 (  81°)   21:49 (  64°)
2018 Nov 16   14:15 (  47°)
2018 Nov 17   23:06 (  13°)
2018 Nov 18   15:32 ( 356°)
2018 Nov 19   07:58 ( 340°)
2018 Nov 20   00:24 ( 323°)   16:49 ( 306°)
2018 Nov 21   09:15 ( 289°)
2018 Nov 22   01:41 ( 272°)   18:07 ( 255°)
2018 Nov 23   10:33 ( 238°)
2018 Nov 24   02:58 ( 221°)   19:24 ( 204°)
2018 Nov 25   11:50 ( 187°)
2018 Nov 26   04:16 ( 170°)
2018 Nov 27   13:07 ( 136°)
2018 Nov 28   05:33 ( 119°)   21:59 ( 102°)
2018 Nov 29   14:25 (  86°)
2018 Nov 30   06:50 (  68°)   23:16 (  51°)
2018 Dec 01   15:42 (  35°)
2018 Dec 02   08:08 (  18°)
2018 Dec 03   00:34 (   1°)   16:59 ( 344°)
2018 Dec 04   09:25 ( 327°)
2018 Dec 05   01:51 ( 310°)   18:17 ( 293°)
2018 Dec 06   10:43 ( 276°)
2018 Dec 07   03:08 ( 259°)   19:34 ( 242°)
2018 Dec 08   12:00 ( 225°)
2018 Dec 09   04:26 ( 208°)   20:52 ( 191°)
2018 Dec 10   13:17 ( 174°)
2018 Dec 11   05:43 ( 157°)   22:09 ( 140°)
2018 Dec 12   14:35 ( 124°)
2018 Dec 13   07:01 ( 107°)
2018 Dec 14   15:52 (  73°)
2018 Dec 15   08:18 (  56°)
2018 Dec 16   00:44 (  39°)   17:10 (  22°)
2018 Dec 17   09:36 (   5°)
2018 Dec 18   02:01 ( 348°)   18:27 ( 331°)
2018 Dec 19   10:53 ( 314°)
2018 Dec 20   03:19 ( 297°)   19:45 ( 280°)
2018 Dec 21   12:10 ( 263°)
2018 Dec 22   04:36 ( 246°)   21:02 ( 229°)
2018 Dec 23   13:28 ( 213°)
2018 Dec 24   05:54 ( 196°)   22:19 ( 178°)
2018 Dec 25   14:45 ( 162°)
2018 Dec 26   07:11 ( 145°)   23:37 ( 128°)
2018 Dec 27   16:03 ( 111°)
2018 Dec 29   00:54 (  77°)   17:20 (  60°)
2018 Dec 30   09:46 (  43°)
2018 Dec 31   02:12 (  26°)   18:38 (   9°)
2019 Jan 01   11:03 ( 352°)
2019 Jan 02   03:29 ( 335°)   19:55 ( 318°)
2019 Jan 03   12:21 ( 301°)
2019 Jan 04   04:47 ( 285°)
2019 Jan 05   13:38 ( 250°)
2019 Jan 06   06:04 ( 234°)   22:30 ( 217°)
2019 Jan 07   14:56 ( 200°)
2019 Jan 08   07:22 ( 183°)   23:47 ( 166°)
2019 Jan 09   16:13 ( 149°)
2019 Jan 10   08:39 ( 132°)
2019 Jan 11   01:05 ( 115°)   17:31 (  98°)
2019 Jan 12   09:56 (  81°)
2019 Jan 13   02:22 (  64°)   18:48 (  47°)
2019 Jan 14   11:14 (  30°)
2019 Jan 15   03:40 (  13°)
2019 Jan 16   12:31 ( 339°)
2019 Jan 17   04:57 ( 323°)   21:23 ( 306°)
2019 Jan 18   13:49 ( 289°)
2019 Jan 19   06:15 ( 272°)   22:40 ( 255°)
2019 Jan 20   15:06 ( 238°)
2019 Jan 21   07:32 ( 221°)   23:58 ( 204°)
2019 Jan 22   16:24 ( 187°)
2019 Jan 23   08:49 ( 170°)
2019 Jan 24   01:15 ( 153°)   17:41 ( 136°)
2019 Jan 25   10:07 ( 119°)
2019 Jan 26   02:33 ( 102°)
2019 Jan 27   11:24 (  68°)
2019 Jan 28   03:50 (  51°)   20:16 (  35°)
2019 Jan 29   12:42 (  18°)
2019 Jan 30   05:08 (   1°)   21:33 ( 344°)
2019 Jan 31   13:59 ( 327°)
------------------------------------------------------------------------------
Links:
2018-06-08
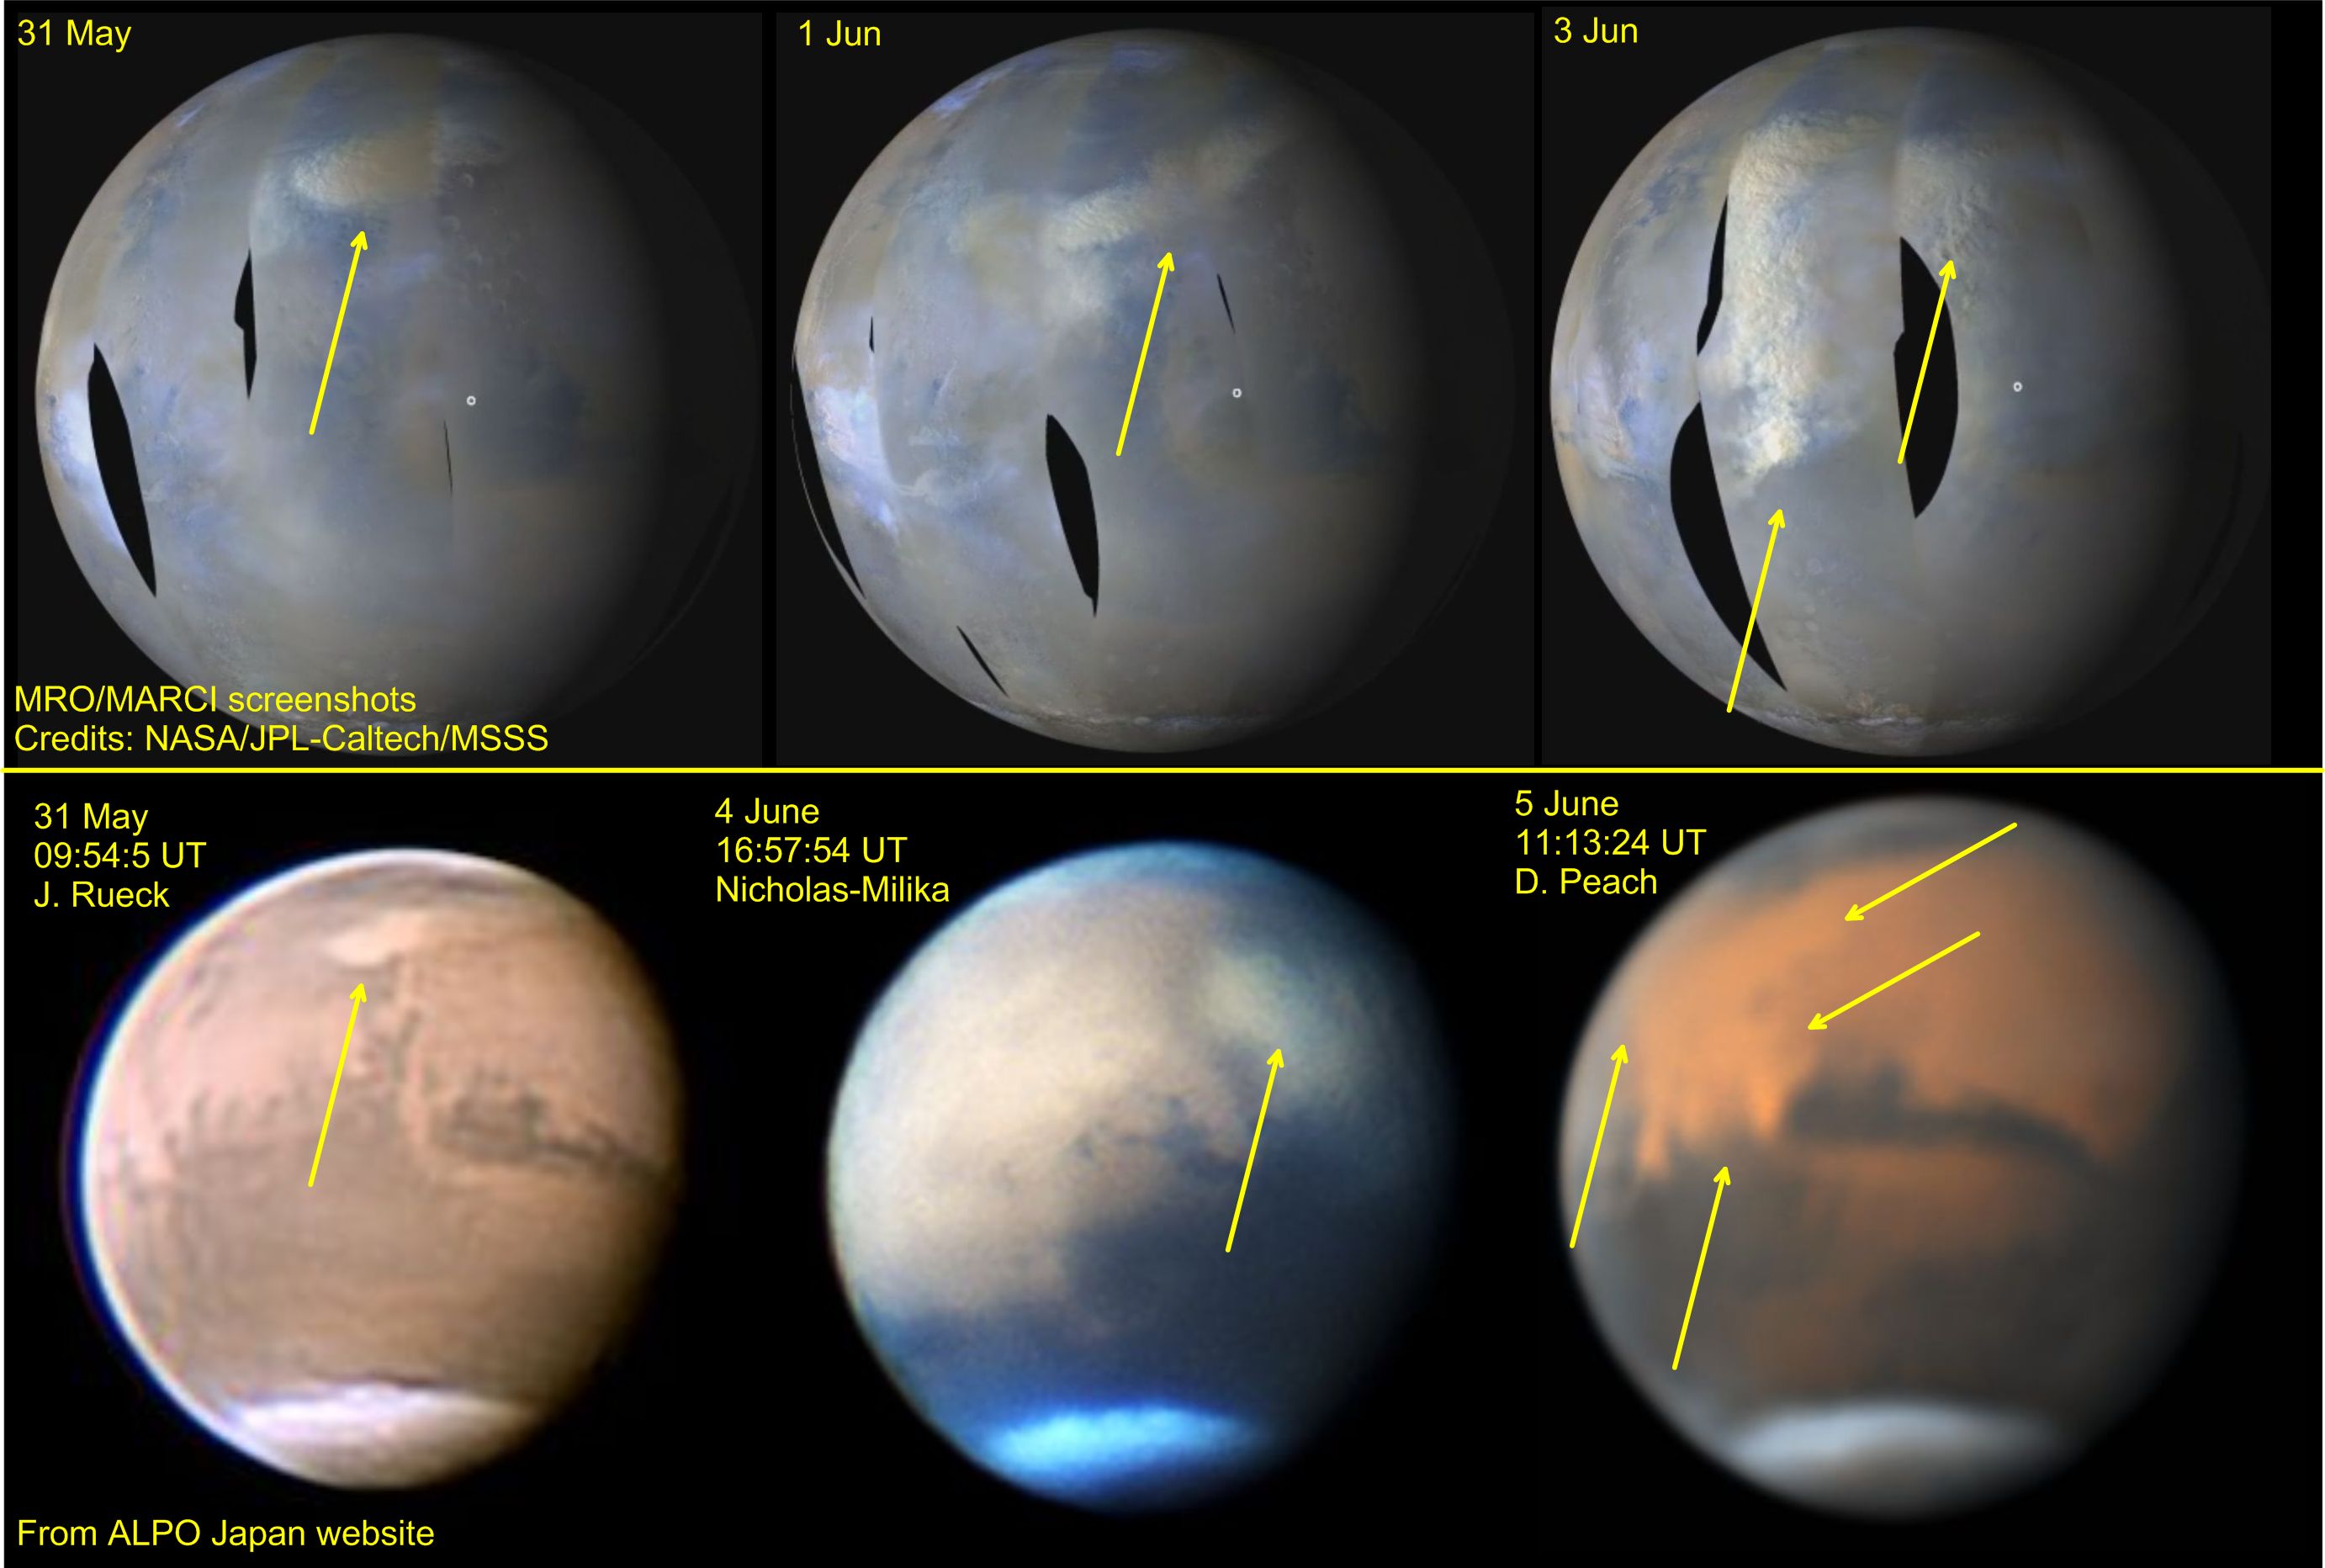 Mars is getting closer to its opposition in July just at the right time in its dusty season. After several detections of regional dust storms in the planet a global storm in Mars is on its development stage. Images by J. Rueck, D. Milika and P. Nicholas and D. Peach among other observers show the onset of this new large-scale storm. Orbiters around Mars are following the extension and growth of the current storm. A report from the MARCI instrument on the MRO mission is available here.
The image on the right compiled by Agustin Sanchez Lavega shows a comparison of amateur observations with data
from the MARCI instrument on Mars Recoinnassance Orbiter.
We encourage all observers to image this Mars dust storm. The five most recent planetary storms detected in Mars occurred in 1977, 1982, 1994, 2001 and 2007. Typical global storms on Mars can develop and lasts over time-scales of a month or longer.
2018-04-22
Saturn continues to display interesting atmospheric activity to the reach of amateur equipment. An
equatorial bright storm with two sides and located at planetographic latitude +6.0 has been observed by several observers since February and notably over April. The feature is probably the same equatorial bright feature observed since 2014 and has been object of recent scientific research(
Sanchez-Lavega et al., Nature Communications, 2016).
Here are ephemeris of its transits over Saturn's CM using System I. Note that besides the prominent Equatorial and polar storms some other repeated features are observed also in the planet at latitudes +20 to +60.
WinJUPOS 10.2.2 (Saturn), C.M. transit times, 2018/05/16  16:41
Object longitude: L1 = 348,4° -  3,8516°/d * (T - 2018 Apr 01,5)
Time interval: 2018 Apr 01,0 ... 2018 Jun 01,0
Output format: Date UT (C.M. of System 1)
------------------------------------------------------------------------------
2018 Apr 01   02:58 ( 350°)   13:10 ( 348°)   23:21 ( 347°)
2018 Apr 02   09:32 ( 345°)   19:43 ( 343°)
2018 Apr 03   05:54 ( 342°)   16:05 ( 340°)
2018 Apr 04   02:17 ( 339°)   12:28 ( 337°)   22:39 ( 335°)
2018 Apr 05   08:50 ( 333°)   19:01 ( 332°)
2018 Apr 06   05:12 ( 330°)   15:24 ( 329°)
2018 Apr 07   01:35 ( 327°)   11:46 ( 325°)   21:57 ( 324°)
2018 Apr 08   08:08 ( 322°)   18:19 ( 320°)
2018 Apr 09   04:31 ( 319°)   14:42 ( 317°)
2018 Apr 10   00:53 ( 316°)   11:04 ( 314°)   21:15 ( 312°)
2018 Apr 11   07:26 ( 310°)   17:38 ( 309°)
2018 Apr 12   03:49 ( 308°)   14:00 ( 306°)
2018 Apr 13   00:11 ( 304°)   10:22 ( 302°)   20:33 ( 301°)
2018 Apr 14   06:45 ( 299°)   16:56 ( 298°)
2018 Apr 15   03:07 ( 296°)   13:18 ( 294°)   23:29 ( 293°)
2018 Apr 16   09:40 ( 291°)   19:51 ( 289°)
2018 Apr 17   06:03 ( 288°)   16:14 ( 286°)
2018 Apr 18   02:25 ( 284°)   12:36 ( 283°)   22:47 ( 281°)
2018 Apr 19   08:58 ( 279°)   19:10 ( 278°)
2018 Apr 20   05:21 ( 276°)   15:32 ( 275°)
2018 Apr 21   01:43 ( 273°)   11:54 ( 271°)   22:05 ( 270°)
2018 Apr 22   08:16 ( 268°)   18:28 ( 267°)
2018 Apr 23   04:39 ( 265°)   14:50 ( 263°)
2018 Apr 24   01:01 ( 262°)   11:12 ( 260°)   21:23 ( 258°)
2018 Apr 25   07:35 ( 257°)   17:46 ( 255°)
2018 Apr 26   03:57 ( 253°)   14:08 ( 252°)
2018 Apr 27   00:19 ( 250°)   10:30 ( 248°)   20:41 ( 247°)
2018 Apr 28   06:53 ( 245°)   17:04 ( 244°)
2018 Apr 29   03:15 ( 242°)   13:26 ( 240°)   23:37 ( 239°)
2018 Apr 30   09:48 ( 237°)   19:59 ( 235°)
2018 May 01   06:11 ( 234°)   16:22 ( 232°)
2018 May 02   02:33 ( 231°)   12:44 ( 229°)   22:55 ( 227°)
2018 May 03   09:06 ( 225°)   19:17 ( 224°)
2018 May 04   05:29 ( 223°)   15:40 ( 221°)
2018 May 05   01:51 ( 219°)   12:02 ( 217°)   22:13 ( 216°)
2018 May 06   08:24 ( 214°)   18:35 ( 212°)
2018 May 07   04:47 ( 211°)   14:58 ( 209°)
2018 May 08   01:09 ( 208°)   11:20 ( 206°)   21:31 ( 204°)
2018 May 09   07:42 ( 203°)   17:53 ( 201°)
2018 May 10   04:05 ( 200°)   14:16 ( 198°)
2018 May 11   00:27 ( 196°)   10:38 ( 195°)   20:49 ( 193°)
2018 May 12   07:00 ( 191°)   17:11 ( 189°)
2018 May 13   03:23 ( 188°)   13:34 ( 187°)   23:45 ( 185°)
2018 May 14   09:56 ( 183°)   20:07 ( 181°)
2018 May 15   06:18 ( 180°)   16:29 ( 178°)
2018 May 16   02:41 ( 177°)   12:52 ( 175°)   23:03 ( 173°)
2018 May 17   09:14 ( 172°)   19:25 ( 170°)
2018 May 18   05:36 ( 168°)   15:47 ( 167°)
2018 May 19   01:58 ( 165°)   12:10 ( 164°)   22:21 ( 162°)
2018 May 20   08:32 ( 160°)   18:43 ( 159°)
2018 May 21   04:54 ( 157°)   15:05 ( 155°)
2018 May 22   01:16 ( 153°)   11:28 ( 152°)   21:39 ( 151°)
2018 May 23   07:50 ( 149°)   18:01 ( 147°)
2018 May 24   04:12 ( 145°)   14:23 ( 144°)
2018 May 25   00:34 ( 142°)   10:46 ( 141°)   20:57 ( 139°)
2018 May 26   07:08 ( 137°)   17:19 ( 136°)
2018 May 27   03:30 ( 134°)   13:41 ( 132°)   23:52 ( 131°)
2018 May 28   10:03 ( 129°)   20:15 ( 128°)
2018 May 29   06:26 ( 126°)   16:37 ( 124°)
2018 May 30   02:48 ( 123°)   12:59 ( 121°)   23:10 ( 119°)
2018 May 31   09:21 ( 117°)   19:33 ( 116°)
------------------------------------------------------------------------------
2018-03-31
Maciel Bassani Sparrengerger has imaged a bright spot on Saturn CM on March 29 at 08:16:05 UT that has later been confirmed by several observers.
http://alpo-j.asahikawa-med.ac.jp/kk18/s180329z.htm
Updated
ephemeris of this feature based on images from 29 March to 22 April are given below as calculated by Marc Delcroix. Urgent observations are required at all longitudes to follow the storm evolution, and search for other possible spots.
WinJUPOS 10.3.9 (Saturn), C.M. transit times, 2018/04/22  00:32
Object longitude: L3 = 181,8° - 11,7054°/d * (T - 2018 Apr 10,5)
Time interval: 2018 Mar 25,0 ... 2018 Jun 01,0
Output format: Date UT (C.M. of System 3)
------------------------------------------------------------------------------
2018 Mar 29   08:16 ( 324°)   18:46 ( 319°)
2018 Mar 30   05:16 ( 314°)   15:46 ( 308°)
2018 Mar 31   02:17 ( 304°)   12:47 ( 299°)   23:17 ( 293°)
2018 Apr 01   09:47 ( 288°)   20:18 ( 283°)
2018 Apr 02   06:48 ( 278°)   17:18 ( 273°)
2018 Apr 03   03:48 ( 268°)   14:19 ( 263°)
2018 Apr 04   00:49 ( 258°)   11:19 ( 252°)   21:49 ( 247°)
2018 Apr 05   08:19 ( 242°)   18:50 ( 237°)
2018 Apr 06   05:20 ( 232°)   15:50 ( 227°)
2018 Apr 07   02:20 ( 221°)   12:51 ( 217°)   23:21 ( 211°)
2018 Apr 08   09:51 ( 206°)   20:21 ( 201°)
2018 Apr 09   06:52 ( 196°)   17:22 ( 191°)
2018 Apr 10   03:52 ( 186°)   14:22 ( 181°)
2018 Apr 11   00:52 ( 175°)   11:23 ( 171°)   21:53 ( 165°)
2018 Apr 12   08:23 ( 160°)   18:53 ( 155°)
2018 Apr 13   05:24 ( 150°)   15:54 ( 145°)
2018 Apr 14   02:24 ( 140°)   12:54 ( 134°)   23:24 ( 129°)
2018 Apr 15   09:55 ( 124°)   20:25 ( 119°)
2018 Apr 16   06:55 ( 114°)   17:25 ( 109°)
2018 Apr 17   03:56 ( 104°)   14:26 (  99°)
2018 Apr 18   00:56 (  94°)   11:26 (  88°)   21:56 (  83°)
2018 Apr 19   08:27 (  78°)   18:57 (  73°)
2018 Apr 20   05:27 (  68°)   15:57 (  63°)
2018 Apr 21   02:27 (  57°)   12:58 (  53°)   23:28 (  48°)
2018 Apr 22   09:58 (  42°)   20:28 (  37°)
2018 Apr 23   06:59 (  32°)   17:29 (  27°)
2018 Apr 24   03:59 (  22°)   14:29 (  17°)
2018 Apr 25   00:59 (  11°)   11:30 (   7°)   22:00 (   1°)
2018 Apr 26   08:30 ( 356°)   19:00 ( 351°)
2018 Apr 27   05:30 ( 346°)   16:01 ( 341°)
2018 Apr 28   02:31 ( 336°)   13:01 ( 331°)   23:31 ( 325°)
2018 Apr 29   10:01 ( 320°)   20:32 ( 315°)
2018 Apr 30   07:02 ( 310°)   17:32 ( 305°)
2018 May 01   04:02 ( 300°)   14:33 ( 295°)
2018 May 02   01:03 ( 290°)   11:33 ( 285°)   22:03 ( 279°)
2018 May 03   08:33 ( 274°)   19:04 ( 269°)
2018 May 04   05:34 ( 264°)   16:04 ( 259°)
2018 May 05   02:34 ( 254°)   13:04 ( 248°)   23:35 ( 244°)
2018 May 06   10:05 ( 239°)   20:35 ( 233°)
2018 May 07   07:05 ( 228°)   17:35 ( 223°)
2018 May 08   04:06 ( 218°)   14:36 ( 213°)
2018 May 09   01:06 ( 208°)   11:36 ( 202°)   22:06 ( 197°)
2018 May 10   08:37 ( 193°)   19:07 ( 187°)
2018 May 11   05:37 ( 182°)   16:07 ( 177°)
2018 May 12   02:37 ( 172°)   13:08 ( 167°)   23:38 ( 162°)
2018 May 13   10:08 ( 156°)   20:38 ( 151°)
2018 May 14   07:08 ( 146°)   17:39 ( 141°)
2018 May 15   04:09 ( 136°)   14:39 ( 131°)
2018 May 16   01:09 ( 126°)   11:39 ( 120°)   22:10 ( 116°)
2018 May 17   08:40 ( 110°)   19:10 ( 105°)
2018 May 18   05:40 ( 100°)   16:10 (  95°)
2018 May 19   02:41 (  90°)   13:11 (  85°)   23:41 (  80°)
2018 May 20   10:11 (  74°)   20:41 (  69°)
2018 May 21   07:11 (  64°)   17:42 (  59°)
2018 May 22   04:12 (  54°)   14:42 (  49°)
2018 May 23   01:12 (  44°)   11:42 (  38°)   22:13 (  34°)
2018 May 24   08:43 (  28°)   19:13 (  23°)
2018 May 25   05:43 (  18°)   16:13 (  13°)
2018 May 26   02:44 (   8°)   13:14 (   3°)   23:44 ( 358°)
2018 May 27   10:14 ( 352°)   20:44 ( 347°)
2018 May 28   07:15 ( 342°)   17:45 ( 337°)
2018 May 29   04:15 ( 332°)   14:45 ( 327°)
2018 May 30   01:15 ( 322°)   11:46 ( 317°)   22:16 ( 312°)
2018 May 31   08:46 ( 306°)   19:16 ( 301°)
------------------------------------------------------------------------------
2018-02-05
A
convective outbreak in the South Temperate Belt has started in the region previously covered by the STB Ghost and following oval BA. Observations by
Anthony Wesley and
Damian Peach show the initial stages of this storm on February 4. Additional images by
Jim Phillips indicate the activity probably started around February 2.
The outbreak is located at longitude 310.8 and planetographic latitude -30.5. It is best observed in IR750nm wavelength and is bright in 890nm images.
Images of this feature will be of high importance as the convection eruption evolves and interacts with the cyclonic region west of BA. Because convective features evolve quickly observations are needed in time-scales of hours at the start of these events and in days and weeks over the evolution of these features.
2017-11-08
Updated on 2017-12-04
Amateur observations of an equatorial bright large cloud in Neptune since June-July and over October and November have allowed to folow different cloud systems over the planet. Equatorial features followed by amateur astronomers in this period includ the close interaction of two equatorial clouds in November 6-10 and what appears to be a chain of equatorial clouds visible afterwards.
Many amateurs now (most notably Phil Miles, Darryl Milika and Pat Nicholas) have observed these cloud systems repeteadly providing very useful data to study this unusual equatorial cloud activity in the planet.
Updated ephemeris of the bright equatorial cloud are given below and have been calculated by Marc Delcroix.
WinJUPOS 10.3.5 (Neptune), C.M. transit times, 2017/12/03  21:05
Object longitude: L = 218,6° + 47,4020°/d * (T - 2017 Oct 22,5)
Time interval: 2017 Dec 01,0 ... 2018 Feb 01,0
Output format: Date UT (C.M. of System 1)
------------------------------------------------------------------------------
2017 Dec 01   09:08 ( 309°)
2017 Dec 02   02:48 ( 344°)   20:29 (  19°)
2017 Dec 03   14:09 (  54°)
2017 Dec 04   07:50 (  89°)
2017 Dec 05   01:30 ( 124°)   19:10 ( 158°)
2017 Dec 06   12:51 ( 193°)
2017 Dec 07   06:31 ( 228°)
2017 Dec 08   00:12 ( 263°)   17:52 ( 298°)
2017 Dec 09   11:33 ( 333°)
2017 Dec 10   05:13 (   8°)   22:54 (  43°)
2017 Dec 11   16:34 (  78°)
2017 Dec 12   10:15 ( 113°)
2017 Dec 13   03:55 ( 148°)   21:35 ( 182°)
2017 Dec 14   15:16 ( 217°)
2017 Dec 15   08:56 ( 252°)
2017 Dec 16   02:37 ( 287°)   20:17 ( 322°)
2017 Dec 17   13:58 ( 357°)
2017 Dec 18   07:38 (  32°)
2017 Dec 19   01:19 (  67°)   18:59 ( 102°)
2017 Dec 20   12:40 ( 137°)
2017 Dec 21   06:20 ( 171°)
2017 Dec 22   00:01 ( 207°)   17:41 ( 241°)
2017 Dec 23   11:21 ( 276°)
2017 Dec 24   05:02 ( 311°)   22:42 ( 346°)
2017 Dec 25   16:23 (  21°)
2017 Dec 26   10:03 (  56°)
2017 Dec 27   03:44 (  91°)   21:24 ( 126°)
2017 Dec 28   15:05 ( 161°)
2017 Dec 29   08:45 ( 195°)
2017 Dec 30   02:26 ( 231°)   20:06 ( 265°)
2017 Dec 31   13:47 ( 300°)
2018 Jan 01   07:27 ( 335°)
2018 Jan 02   01:08 (  10°)   18:48 (  45°)
2018 Jan 03   12:28 (  80°)
2018 Jan 04   06:09 ( 115°)   23:49 ( 150°)
2018 Jan 05   17:30 ( 185°)
2018 Jan 06   11:10 ( 219°)
2018 Jan 07   04:51 ( 254°)   22:31 ( 289°)
2018 Jan 08   16:12 ( 324°)
2018 Jan 09   09:52 ( 359°)
2018 Jan 10   03:33 (  34°)   21:13 (  69°)
2018 Jan 11   14:54 ( 104°)
2018 Jan 12   08:34 ( 139°)
2018 Jan 13   02:15 ( 174°)   19:55 ( 209°)
2018 Jan 14   13:36 ( 244°)
2018 Jan 15   07:16 ( 278°)
2018 Jan 16   00:56 ( 313°)   18:37 ( 348°)
2018 Jan 17   12:17 (  23°)
2018 Jan 18   05:58 (  58°)   23:38 (  93°)
2018 Jan 19   17:19 ( 128°)
2018 Jan 20   10:59 ( 163°)
2018 Jan 21   04:40 ( 198°)   22:20 ( 233°)
2018 Jan 22   16:01 ( 268°)
2018 Jan 23   09:41 ( 302°)
2018 Jan 24   03:22 ( 337°)   21:02 (  12°)
2018 Jan 25   14:42 (  47°)
2018 Jan 26   08:23 (  82°)
2018 Jan 27   02:03 ( 117°)   19:44 ( 152°)
2018 Jan 28   13:24 ( 187°)
2018 Jan 29   07:05 ( 222°)
2018 Jan 30   00:45 ( 256°)   18:26 ( 292°)
2018 Jan 31   12:06 ( 326°)
------------------------------------------------------------------------------
2017-04-12
The
Cassini mission: Imaging Sub-System (ISS), Composite Infrared Spectrometer (CIRS) and Visible-Near Infrared Mapping Spectrometer (VIMS) will be getting very high-resolution observations soon (2017 April 26) during the spacecraft’s initial “dive” between the planet and the inner rings.
The ISS images will have a very restricted coverage of the atmosphere, so observations from the Earth are being solicited by Dr. Linda Spilker, Cassini Chief Scientist and the different instrument teams.
Best times for observations will be ffrom UTC 07:48:11 to 12:22:11 but any close in time observations will be very useful.
-
ISS captures high resolution WAC images of the upper atmosphere as its field of view skims across the North Pole towards the equator, outlining what is affectionately called “the noodle.” The main target of the noodle is north equatorial latitudes from about 20 deg North (when the camera reaches around 500m/pix resolution) to about -8 deg South (where Saturn is shadowed by the rings). CIRS will get 2km resolution, about 20x higher resolution then limb sounding and perhaps 100x higher than previous nadir observations. VIMS will be able to get about 50x better pixel resolution than our previous best images. During the HGA-to-Ram pointed time, ISS observes the best resolution of about 200 m/pixel (10x better than previous images), looking for small convective clouds for the clouds revealing the waves in Saturn's atmosphere. Those clouds and waves may indicate deep thunderstorms in the atmosphere.
Message sent by Dr. Glenn S. Orton (JPL/NASA) on behalf of Dr. Linda Spilker (Cassini Chief Scientist).
2017-02-08
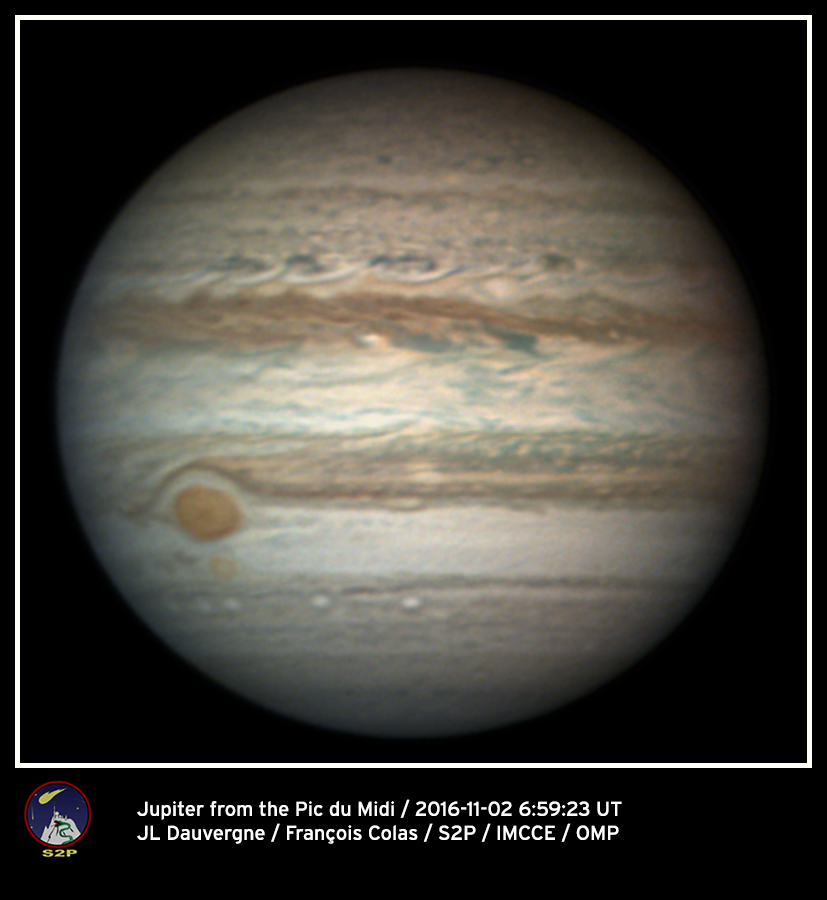
The Jupiter outbreak in the North Temperate Belt (NTB) that started in October 2016 has severely modified the aspect of the long lived
North Tropical Oval called
WZ. This oval formed from the merger of two other smaller ovals in 2012 (one of them present since 2008), and has experienced interesting color changes from white to red and back to white during its history.
Observations
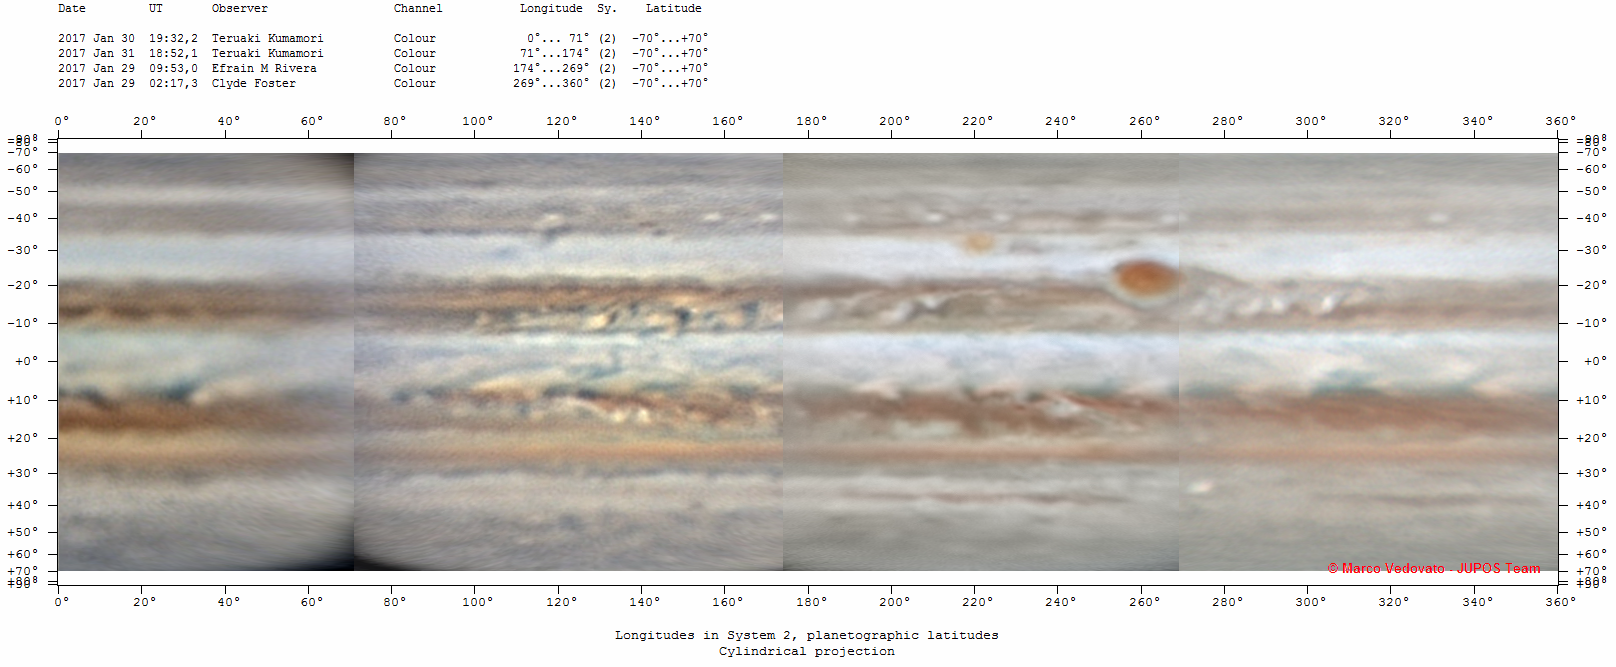
obtained at the Pic Du Midi on November 2 show the latest images of this oval at the time of its interaction with the outbreak in the North Temperate Belt. The latest maps
of the planet from January 30 compiled by Marco Vedovado shows this feature with low contrast and is only apparent in the higher resolution images. The oval, is still present in the atmosphere with a different coloration, cloud morphology and size as this image from Phil Miles shows.
We urge continuous observations in particular in blue, violet and ultraviolet and in the 890nm methane absorption band to characterize its color and constraint the altitude of the remains of this oval.
2016-12-30
Jupiter observations by Phil Miles show the development of a convective outbreak within Jupiter's South Equatorial Belt (SEB). The SEB is currently in a "non-Fade" stage. This source has erupted on a "whitish" spot according to previous images by Tiziano Olivetti on December 23. The convective source is at B" -16º and 301º (III). It is important to track its evolution, i. e. if it develops into a planetary-scale disturbance or if it is just dispersed by the horizontal wind shear.
2017-01-07: A first report of this activity is now available at the BAA thanks to John Rogers:
https://britastro.org/node/8817
2016-11-03
Dr. Glenn Orton from the Juno mission has provided the following list of Juno perijoves. Amateur observations closely before and after these dates will be very useful to the scientists on Juno.
This list has been updated on May 2019.
Dates of Juno Perijoves
A more complete information can be obtained at the pages maintained by John Rogers on the British Astronomical Association
BAA: Full list of Juno's orbits
Read all the news

